. 2021 May 11;13(5):880.
doi: 10.3390/v13050880.

Cytokines and Leukocytes Subpopulations Profile in SARS-CoV-2 Patients Depending on the CT Score Severity

Affiliations

Cytokines and Leukocytes Subpopulations Profile in SARS-CoV-2 Patients Depending on the CT Score Severity

Elżbieta Rutkowska et al. Viruses. .

Abstract

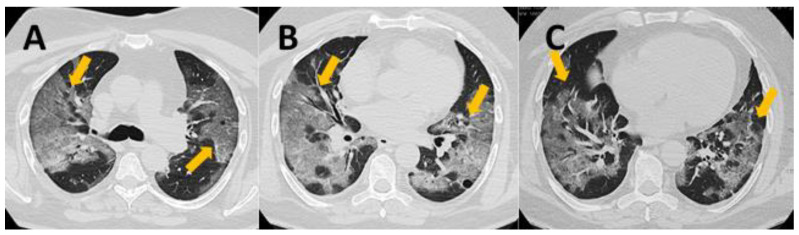
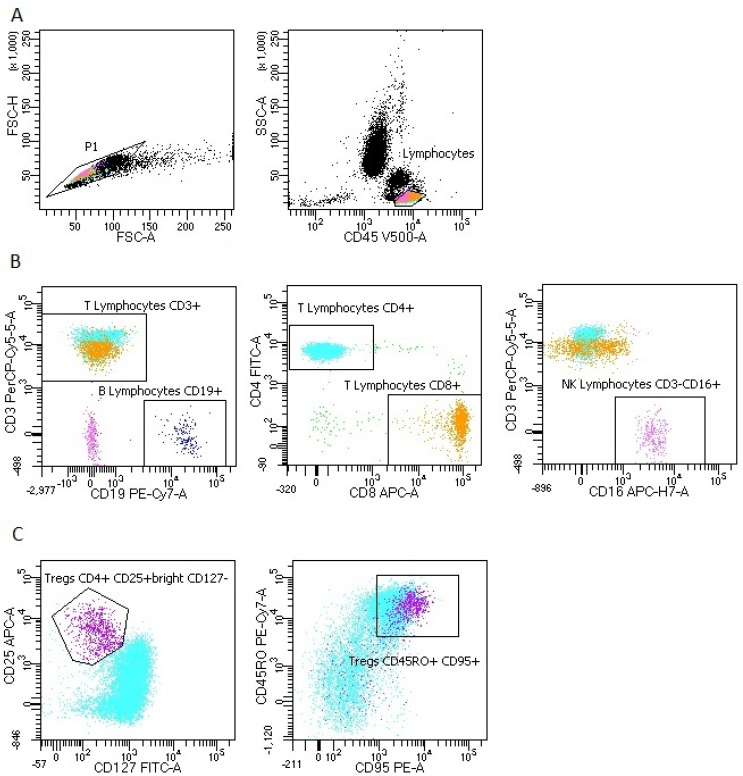
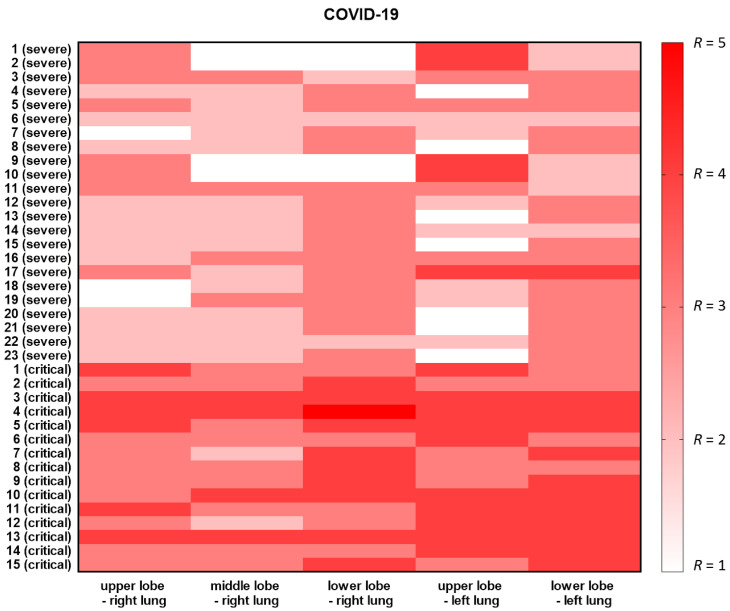
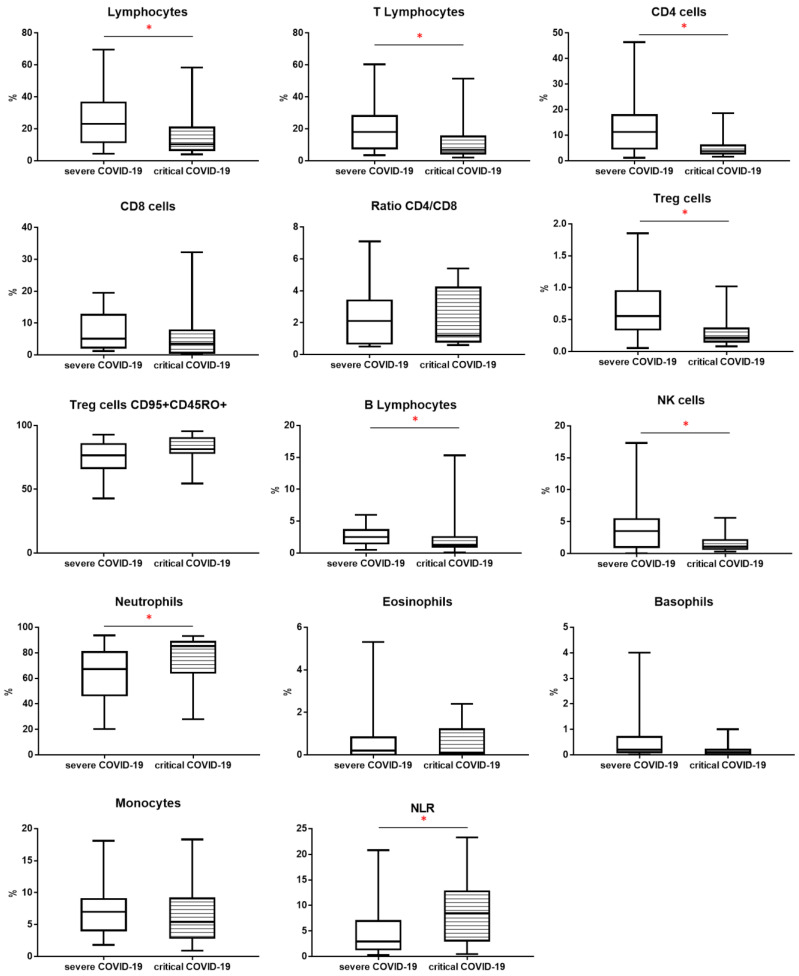
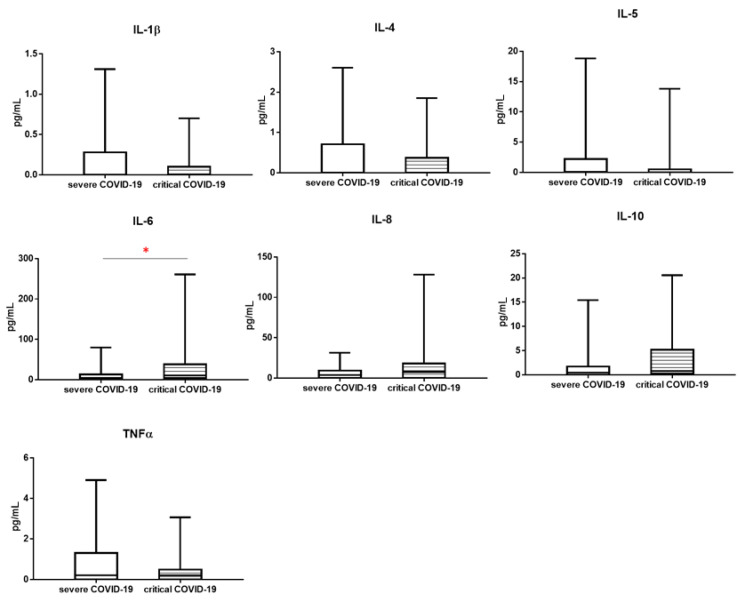
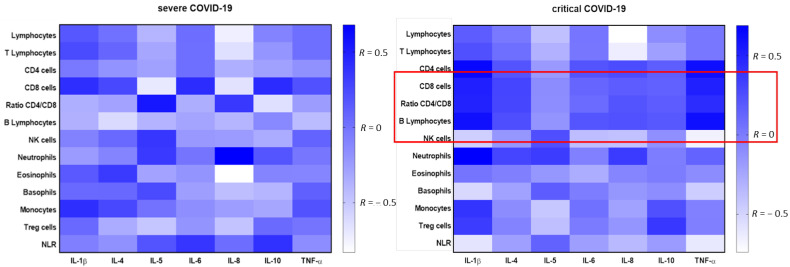
The role of the adaptive microenvironment components in severe acute respiratory syndrome coronavirus 2 (SARS-Cov-2) infection is widely researched, but remains unclear. Studying the common dynamics of adaptive immune response changes can help understand the pathogenesis of coronavirus disease 2019 (COVID-19), especially in critical patients. The aim of the present study was to determine the cytokines concentration and leukocyte subpopulations profiles in the severe COVID-19 (n = 23) and critical (n = 18) COVID-19 group distinguished by the computed tomography (CT) severity score. We observed lower percentage of lymphocyte subpopulation, higher neutrophils to lymphocytes ratio (NLR) and higher IL-6 concentration in critical COVID-19 group than in severe group. CT severity score was negative correlated with proportion of lymphocytes, lymphocytes T, CD4+ cells, Treg cells and NK cells and positive correlated with neutrophils, NLR, and IL-6. In critical group more correlations between cytokines and lymphocytes were observed, mainly between TNF-α, IL-1β and lymphocyte subpopulations. The collective assessment of the cytokine profile, leukocyte subpopulations and the CT severity score can help to characterize and differentiate patient in advanced COVID-19 than the study of single parameters. We have shown that the interconnection of elements of the adaptive microenvironment can play an important role in critical COVID-19 cases.

Keywords: CT severity score; IL-1β; IL-6; SARS-CoV-2; T regulatory cell; TNF-α; computed tomography; cytokines; leukocyte; lymphocyte.


Conflict of interest statement

The authors declare no conflict of interest.

Figures

Figure A1
Figure A1
The example of CT changes in patient with critical COVID severity score 20—4 points (50 to 75% of lung tissue involvement) for the each of lung lobe. (A) axial scan at the level of upper lobes; (B) axial scan at the level of middle lobe on the right side, lingua on the left side and the upper segments of lower lobes; (C) axial scan at the level of the basal segments of the lower lobes. The yellow arrows points ground-glass and crazy paving opacifications.
Figure A2
Figure A2
Representative FACS analysis of PB cells with antibodies specific for lymphocytes subpopulations and T regulatory (Treg) cells. (A) Lymphocytes gating strategy: FSC-A vs. FSC-H plot: Gating the cells that have an equal area and height, thus removing clumps (greater FSC-A relative to FSC-H) and debris (very low FSC), CD45 vs. SSC-A plot: Selection of lymphocytes based on their SSC/CD45+ properties. (B) Lymphocyte subpopulation gating strategy: CD3 vs. CD19 plot: Selection of lymphocytes T (blue and yellow) based on their CD3+ properties and lymphocytes B (navy blue) based on their CD19+ properties. CD4 vs. CD8 plot: Selection of T lymphocytes subsets CD4+ (blue) and CD8+ (yellow) based on their CD4/CD8 properties. CD3 vs. CD16 plot: Selection of NK cells (pink) based on their CD16+ properties and CD3 negative. (C) Treg cells and Tregs subsets gating strategy: CD25 vs. CD127 plot: Selection of Treg cells (purple) based on their CD25+high and CD127 negative properties. CD45RO vs. CD95 plot: Treg cells subset with CD45RO and CD95 expression.
Figure 1
Figure 1
Heatmap with CT severity score in each patient. Lung lesion advancement grading was shown based on visual assessment of the degree of pulmonary tissue involvement by lesions in individual lobes (three lobes of the right lung and two lobes of the left lung). Each lobe was awarded a CT score from 0 (white) to 5 (red), depending on the percentage of the involved lobe.
Figure 2
Figure 2
The differences of percentage of leukocytes, lymphocytes subpopulation and NLR between patients: with severe COVID-19 and critical COVID-19. Graphs show the median values (Min-Max) * p < 0.05. Lymphocytes, T, B, CD4, CD8, NK cells, T regulatory (Treg) cells, neutrophils, eosinophils, basophils and monocytes are presented as % of leukocytes. Treg cells CD95+ CD45RO+ is presented as % of Treg cells.
Figure 3
Figure 3
The differences of cytokines concentrations between patients: with severe COVID-19 and critical COVID-19. Graphs show the median values (Min–Max), * p < 0.05.
Figure 4
Figure 4
A heatmap of Spearman correlation coefficients for the cytokine levels with leukocytes using multiparameter flow cytometry in severe COVID-19 and critical COVID-19 group. Correlations with an absolute value more than 0.5 are associated with p < 0.05, blue—positive correlations, white—negative correlations. The red line highlights significant positive, strong correlations between the studied parameters in the critical group.

Similar articles

Cited by

References

    1. Chauhan S. Comprehensive review of coronavirus disease 2019 (COVID-19) Biomed. J. 2020;43:334–340. doi: 10.1016/j.bj.2020.05.023. - DOI - PMC - PubMed
    1. Huang C., Wang Y., Li X., Ren L., Zhao J., Hu Y., Zhang L., Fan G., Xu J., Gu X., et al. Clinical features of patients infected with 2019 novel coronavirus in Wuhan, China. Lancet. 2020;395:497–506. doi: 10.1016/S0140-6736(20)30183-5. - DOI - PMC - PubMed
    1. Alnor A., Sandberg M.B., Toftanes B.E., Vinholt P.J. Platelet parameters and leukocyte morphology is altered in COVID-19 patients compared to non-COVID-19 patients with similar symptomatology. Scand. J. Clin. Lab. Investig. 2021;81:213–217. doi: 10.1080/00365513.2021.1894601. - DOI - PubMed
    1. Velavan T.P., Meyer C.G. Mild versus severe COVID-19: Laboratory markers. Int. J. Infect. Dis. 2020;95:304–307. doi: 10.1016/j.ijid.2020.04.061. - DOI - PMC - PubMed
    1. Hojyo S., Uchida M., Tanaka K., Hasebe R., Tanaka Y., Murakami M., Hirano T. How COVID-19 induces cytokine storm with high mortality. Inflamm. Regen. 2020;40:37. doi: 10.1186/s41232-020-00146-3. - DOI - PMC - PubMed

Publication types

MeSH terms