. 2021 May 11;26(10):2851.
doi: 10.3390/molecules26102851.

Phase Transitions and Structural Changes in DPPC Liposomes Induced by a 1-Carba-Alpha-Tocopherol Analogue

Affiliations

Phase Transitions and Structural Changes in DPPC Liposomes Induced by a 1-Carba-Alpha-Tocopherol Analogue

Grażyna Neunert et al. Molecules. .

Abstract

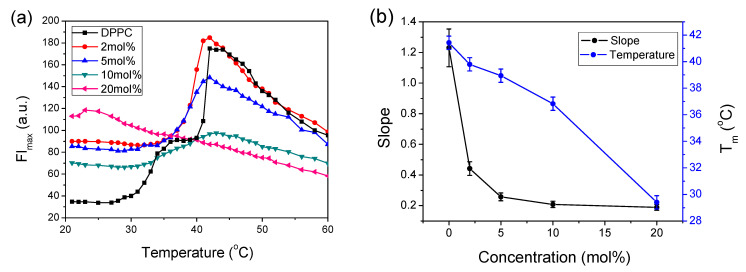
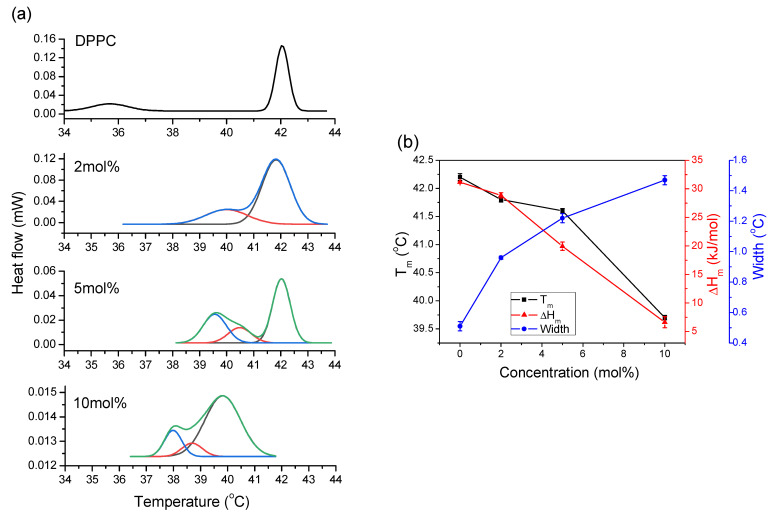
Steady-state emission spectroscopy of 1-anilino-8- naphthalene sulfonate (ANS) and 1,6-diphenyl-1,3,5-hexatriene (DPH), fluorescence anisotropy, and DSC methods were used to characterize the interactions of the newly synthesized 1-carba-alpha-tocopherol (CT) with a 1,2-dipalmitoyl-sn-glycero-3-phosphocholine (DPPC) membrane. The DSC results showed significant perturbations in the DPPC structure for CT concentrations as low as 2 mol%. The main phase transition peak was broadened and shifted to lower temperatures in a concentration-dependent manner, and pretransition was abolished. Increasing CT concentrations induced the formation of new phases in the DPPC structure, leading to melting at lower temperatures and, finally, disruption of the ordered DPPC structure. Hydration and structural changes of the DPPC liposomes using ANS and DPH fluorescent probes, which are selectively located at different places in the bilayer, were studied. With the increased concentration of CT molecules in the DPPC liposomes, structural changes with the simultaneous formation of different phases of such mixture were observed. Temperature studies of such mixtures revealed a decrease in the temperature of the main phase transition and fluidization at decreasing temperatures related to increasing hydration in the bilayer. Contour plots obtained from concentration-temperature data with fluorescent probes allowed for identification of different phases, such as gel, ordered liquid, disordered liquid, and liquid crystalline phases. The CT molecule with a modified chromanol ring embedded in the bilayer led to H-bonding interactions, expelling water molecules from the interphase, thus introducing disorder and structural changes to the highly ordered gel phase.

Keywords: ANS fluorescence; DPH emission polarization; alpha-tocopherol carba analogue; liposome melting; phase transition.


Conflict of interest statement

The authors declare no conflict of interest.

Figures

Figure 1
Figure 1
Changes in the ANS fluorescence intensity at the emission maximum (FImax) versus temperature with the increasing presence of CT in 0.08 mg/mL DPPC: (a) during heating from 20 °C to 60 °C; (b) plot of fitted parameters to Equation (1) of transition temperature (Tm) and slope obtained during heating versus CT concentrations. ΔT = 0.5 °C.
Figure 2
Figure 2
(a) Positions of ANS emission maxima (λmax) versus temperature with increasing presence of CT in 0.08 mg/mL DPPC during heating from 20 °C to 60 °C; (b) kinetics of ANS transport into the DPPC membrane at 25 °C. The concentration of CT is given in the legend.
Figure 3
Figure 3
Effect of CT on DPH anisotropy in DPPC liposome: (a) temperature profiles of DPH anisotropy in 0.08 mg/mL DPPC at increasing concentrations of CT are given in the legend; (b) changes in DPH anisotropy in the gel phase at 25 °C and in the liquid crystalline phase at 48 °C; (c) plot of parameters fitted to Equation (1); Tm, the temperature of the phase transition (right axis) and the slope (left axis). ΔT = 0.5 °C.
Figure 4
Figure 4
(a) Smoothed DSC traces of DPPC liposomes (2 mg/mL), with an increasing concentration of CT, given in the plot. The plot also shows the fitted components to the total DSC trace. Please note the decreasing intensity on the ordinate axis; (b) effect of incorporation of different concentrations of CT into DPPC on the main phase transition temperature, Tm, the width of the main peak, and the enthalpy of transition, ∆Hm. Please note decreasing values on y-axis plots.
Figure 5
Figure 5
Zeta potential (ZP) of the 0.08 mg/mL DPPC membrane in the presence of increasing amounts of CT. Error bars are SDs calculated for three different repetitions.
Figure 6
Figure 6
Absorbance at 517 nm of DPPH radicals in methanol in the presence of CT or α-T after 15 and 30 min of incubation. Indicated values represent the means ± SD arising from triplicate experiments.
Figure 7
Figure 7
Contour plots of ANS and DPH; (a) packing density, using ANS FImax data from Figure 1a; (b) hydrophobicity, using ANS λmax data from Figure 2a; (c) order–disorder, using data from DPH emission anisotropy given in Figure 3a.
Figure 8
Figure 8
Chemical structures of α-tocopherol (α-T) and 1-carba-α-tocopherol (CT).

References

    1. Wang X., Quinn P.J. Vitamin E and its function in membranes. Prog. Lipid Res. 1999;38:309–336. doi: 10.1016/S0163-7827(99)00008-9. - DOI - PubMed
    1. Azzi A., Stocker A. Vitamin E: Non-antioxidant roles. Prog. Lipid Res. 2000;39:231–255. doi: 10.1016/S0163-7827(00)00006-0. - DOI - PubMed
    1. Zingg J.-M., Azzi A. Non-antioxidant activities of vitamin E. Curr. Med. Chem. 2012;11:1113–1133. doi: 10.2174/0929867043365332. - DOI - PubMed
    1. Niki E. Role of vitamin E as a lipid-soluble peroxyl radical scavenger: In vitro and in vivo evidence. Free Radic. Biol. Med. 2014;66:3–12. doi: 10.1016/j.freeradbiomed.2013.03.022. - DOI - PubMed
    1. Burton G.W., Ingold K.U. Vitamin E: Application of the principles of physical organic chemistry to the exploration of its structure and function. Acc. Chem. Res. 1986;19:194–201. doi: 10.1021/ar00127a001. - DOI

LinkOut - more resources