Expression of E-Cadherin in Epithelial Cancer Cells Increases Cell Motility and Directionality through the Localization of ZO-1 during Collective Cell Migration
- PMID: 34064908
- PMCID: PMC8151941
- DOI: 10.3390/bioengineering8050065
Expression of E-Cadherin in Epithelial Cancer Cells Increases Cell Motility and Directionality through the Localization of ZO-1 during Collective Cell Migration
Abstract
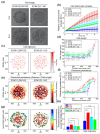
Collective cell migration of epithelial tumor cells is one of the important factors for elucidating cancer metastasis and developing novel drugs for cancer treatment. Especially, new roles of E-cadherin in cancer migration and metastasis, beyond the epithelial-mesenchymal transition, have recently been unveiled. Here, we quantitatively examined cell motility using micropatterned free edge migration model with E-cadherin re-expressing EC96 cells derived from adenocarcinoma gastric (AGS) cell line. EC96 cells showed increased migration features such as the expansion of cell islands and straightforward movement compared to AGS cells. The function of tight junction proteins known to E-cadherin expression were evaluated for cell migration by knockdown using sh-RNA. Cell migration and straight movement of EC96 cells were reduced by knockdown of ZO-1 and claudin-7, to a lesser degree. Analysis of the migratory activity of boundary cells and inner cells shows that EC96 cell migration was primarily conducted by boundary cells, similar to leader cells in collective migration. Immunofluorescence analysis showed that tight junctions (TJs) of EC96 cells might play important roles in intracellular communication among boundary cells. ZO-1 is localized to the base of protruding lamellipodia and cell contact sites at the rear of cells, indicating that ZO-1 might be important for the interaction between traction and tensile forces. Overall, dynamic regulation of E-cadherin expression and localization by interaction with ZO-1 protein is one of the targets for elucidating the mechanism of collective migration of cancer metastasis.
Keywords: E-cadherin; ZO-1; cancer metastasis; cell patterning; directionality; motility.
Conflict of interest statement
The authors declare no conflict of interest. The funders had no role in the design of the study; in the collection, analyses, or interpretation of data; in the writing of the manuscript, or in the decision to publish the results.
Figures


Similar articles
-
Yes-Associated Protein Is Required for ZO-1-Mediated Tight-Junction Integrity and Cell Migration in E-Cadherin-Restored AGS Gastric Cancer Cells.Biomedicines. 2021 Sep 18;9(9):1264. doi: 10.3390/biomedicines9091264. Biomedicines. 2021. PMID: 34572450 Free PMC article.
-
The Leader Position of Mesenchymal Cells Expressing N-Cadherin in the Collective Migration of Epithelial Cancer.Cells. 2020 Mar 16;9(3):731. doi: 10.3390/cells9030731. Cells. 2020. PMID: 32188112 Free PMC article.
-
Cadherin mechanotransduction in leader-follower cell specification during collective migration.Exp Cell Res. 2019 Mar 1;376(1):86-91. doi: 10.1016/j.yexcr.2019.01.006. Epub 2019 Jan 8. Exp Cell Res. 2019. PMID: 30633881 Review.
-
Loss of the tight junction protein claudin 4 correlates with histological growth-pattern and differentiation in advanced gastric adenocarcinoma.Oncol Rep. 2005 Feb;13(2):193-9. Oncol Rep. 2005. PMID: 15643498
-
MicroRNA Regulation of Endothelial Junction Proteins and Clinical Consequence.Mediators Inflamm. 2016;2016:5078627. doi: 10.1155/2016/5078627. Epub 2016 Nov 24. Mediators Inflamm. 2016. PMID: 27999452 Free PMC article. Review.
Cited by
-
Research progress on the protective mechanism of a novel soluble epoxide hydrolase inhibitor TPPU on ischemic stroke.Front Neurol. 2023 Feb 8;14:1083972. doi: 10.3389/fneur.2023.1083972. eCollection 2023. Front Neurol. 2023. PMID: 36846137 Free PMC article. Review.
-
A comprehensive analysis of different types of databases reveals that CDH1 mRNA and E-cadherin protein are not downregulated in most carcinoma tissues and carcinoma cell lines.BMC Cancer. 2023 May 15;23(1):441. doi: 10.1186/s12885-023-10916-0. BMC Cancer. 2023. PMID: 37189027 Free PMC article.
-
Yes-Associated Protein Is Required for ZO-1-Mediated Tight-Junction Integrity and Cell Migration in E-Cadherin-Restored AGS Gastric Cancer Cells.Biomedicines. 2021 Sep 18;9(9):1264. doi: 10.3390/biomedicines9091264. Biomedicines. 2021. PMID: 34572450 Free PMC article.
-
Evaluation of the anticancer effects of hydroxycinnamic acid isomers on breast cancer stem cells.Med Oncol. 2025 Feb 11;42(3):73. doi: 10.1007/s12032-025-02618-3. Med Oncol. 2025. PMID: 39932626 Free PMC article.
-
Quercetin effectively improves LPS-induced intestinal inflammation, pyroptosis, and disruption of the barrier function through the TLR4/NF-κB/NLRP3 signaling pathway in vivo and in vitro.Food Nutr Res. 2022 Dec 30;66. doi: 10.29219/fnr.v66.8948. eCollection 2022. Food Nutr Res. 2022. PMID: 36793340 Free PMC article.
References
LinkOut - more resources
Full Text Sources

