. 2021 May 9;22(9):5017.
doi: 10.3390/ijms22095017.

Fusicoccin (FC)-Induced Rapid Growth, Proton Extrusion and Membrane Potential Changes in Maize (Zea mays L.) Coleoptile Cells: Comparison to Auxin Responses

Affiliations

Fusicoccin (FC)-Induced Rapid Growth, Proton Extrusion and Membrane Potential Changes in Maize (Zea mays L.) Coleoptile Cells: Comparison to Auxin Responses

Małgorzata Polak et al. Int J Mol Sci. .

Abstract

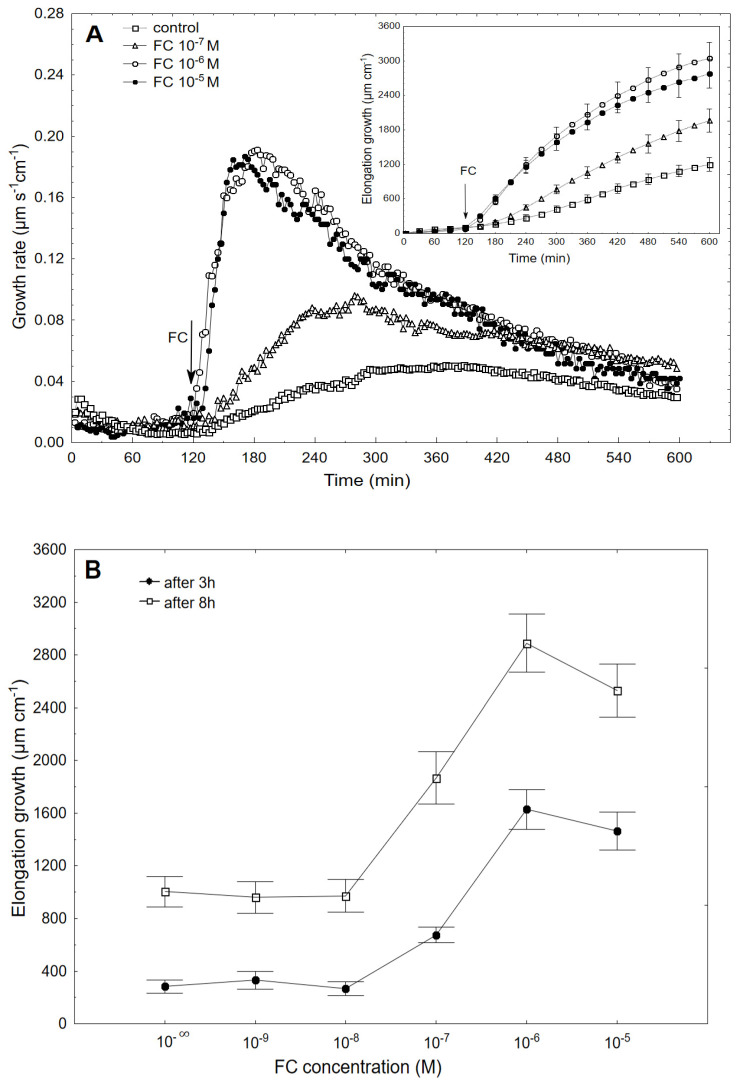
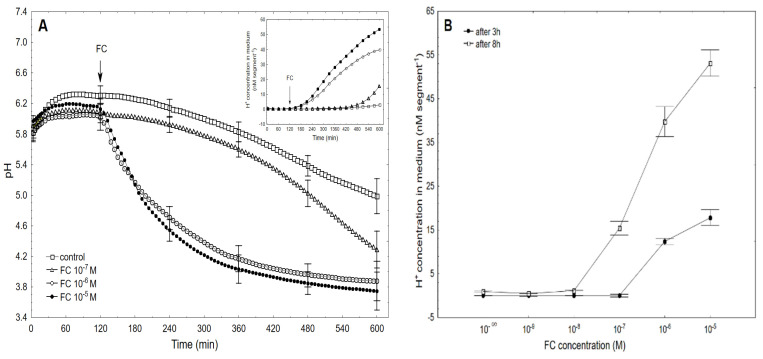
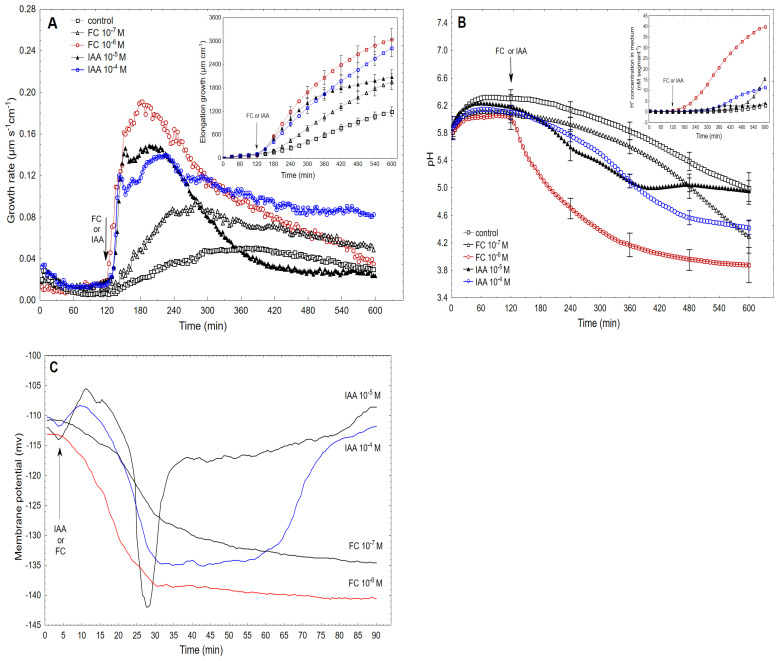
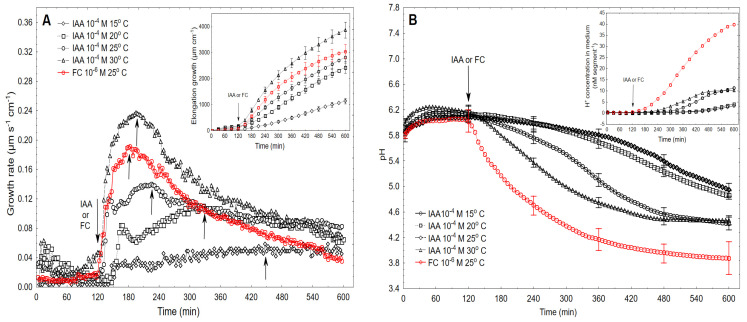
The fungal toxin fusicoccin (FC) induces rapid cell elongation, proton extrusion and plasma membrane hyperpolarization in maize coleoptile cells. Here, these three parameters were simultaneously measured using non-abraded and non-peeled segments with the incubation medium having access to their lumen. The dose-response curve for the FC-induced growth was sigmoidal shaped with the maximum at 10-6 M over 10 h. The amplitudes of the rapid growth and proton extrusion were significantly higher for FC than those for indole-3-acetic acid (IAA). The differences between the membrane potential changes that were observed in the presence of FC and IAA relate to the permanent membrane hyperpolarization for FC and transient hyperpolarization for IAA. It was also found that the lag times of the rapid growth, proton extrusion and membrane hyperpolarization were shorter for FC compared to IAA. At 30 °C, the biphasic kinetics of the IAA-induced growth rate could be changed into a monophasic (parabolic) one, which is characteristic for FC-induced rapid growth. It has been suggested that the rates of the initial phase of the FC- and IAA-induced growth involve two common mechanisms that consist of the proton pumps and potassium channels whose contribution to the action of both effectors on the rapid growth is different.

Keywords: Auxin (IAA); coleoptile segments; fusicoccin; growth; membrane potential; proton extrusion.


Conflict of interest statement

The authors declare no conflict of interest.

Figures

Figure 1
Figure 1
Growth rate (µm s−1cm−1) of the maize coleoptile segments that had been incubated in the presence of 10−7, 10−6 and 10−5 M of FC (A) and the dose–response curves for the FC (10−9–10−5 M)-induced total elongation growth of the coleoptile segments as a function of time (B). The coleoptile segments were first preincubated (over 2 h) in a control medium to which FC had been added (arrow). The inset in Figure 1A shows the total elongation growth (µm cm−1), which was calculated as the sum of the extensions from 3 min interval measurements over 10 h. All of the curves are the means of at least five independent experiments. Bars indicate ± SE.
Figure 2
Figure 2
Kinetics of the medium pH changes of the coleoptile segments that had been incubated in the presence of 10−7, 10−6 and 10−5 M of FC (A), the dose–response curves for the FC (10−9–10−5 M)-induced medium pH changes (expressed as changes in the H+ concentration per coleoptile segment, nM segment−1 or nM cm−1) of the coleoptile segments as a function of time (B), and correlation between elongation (µm segment−1) and proton extrusion (nM segment−1) for two time intervals; the first, from the addition of FC to the end of the experiment (120–600 min) (0 < x < 40) (C), and the second starting 30 min later (150–600 min) (x > 9) (D). In the second time interval, the FC-induced rapid growth was omitted. The inset in Figure 2A shows the proton extrusion, which was expressed as the changes in the H+ concentration per coleoptile segment. The coleoptile segments were first preincubated (over 2 h) in the control medium to which FC was added (arrow). The pH values are the means of at least five independent experiments that were performed simultaneously with growth (shown in Figure 1) using the same tissue samples. Bars indicate ± SE.
Figure 2
Figure 2
Kinetics of the medium pH changes of the coleoptile segments that had been incubated in the presence of 10−7, 10−6 and 10−5 M of FC (A), the dose–response curves for the FC (10−9–10−5 M)-induced medium pH changes (expressed as changes in the H+ concentration per coleoptile segment, nM segment−1 or nM cm−1) of the coleoptile segments as a function of time (B), and correlation between elongation (µm segment−1) and proton extrusion (nM segment−1) for two time intervals; the first, from the addition of FC to the end of the experiment (120–600 min) (0 < x < 40) (C), and the second starting 30 min later (150–600 min) (x > 9) (D). In the second time interval, the FC-induced rapid growth was omitted. The inset in Figure 2A shows the proton extrusion, which was expressed as the changes in the H+ concentration per coleoptile segment. The coleoptile segments were first preincubated (over 2 h) in the control medium to which FC was added (arrow). The pH values are the means of at least five independent experiments that were performed simultaneously with growth (shown in Figure 1) using the same tissue samples. Bars indicate ± SE.
Figure 3
Figure 3
Kinetics of the FC- and IAA-induced growth rate (A), medium pH (B) and membrane potential (C) measured simultaneously at their optimal and suboptimal concentrations. The data for IAA-induced growth, proton extrusion and membrane potential changes was adopted from our recently published paper [8]. The growth rate (µm s−1 cm−1) of the maize coleoptile segments that had been incubated in the presence of the suboptimal (10−7 M) and optimal concentrations of FC (10−6 M, red curve) and both the suboptimal (10−5 M) and optimal (10−4 M, blue curve) concentrations of IAA are shown. The coleoptile segments were first preincubated (over 2 h) in the control medium to which FC or IAA was added (arrow). The insets show the total elongation growth (µm cm−1), which was calculated as the sum of the extensions from 3 min interval measurements over 10 h (Figure 3A) and the proton extrusion is expressed as the changes in the H+ concentration per coleoptile segment (Figure 3B). The medium pH changes were measured simultaneously with growth (Figure 3A) using the same tissue samples (red and blue curves as in Figure 3A). The membrane potential changes of the parenchymal coleoptile cells, which were simultaneously measured with the growth and medium pH changes and recorded at the suboptimal and optimal concentrations of FC and IAA are shown. All of the curves are the means of at least five independent experiments. Bars indicate ± SE.
Figure 4
Figure 4
Effect of temperature (15, 20, 25 and 30 °C) on the growth rate (A) and medium pH (B) of the maize coleoptile segments that had been incubated in the presence of the optimal concentration of the IAA (10−4 M). For comparison, the effect of the optimal concentration of FC (10−6 M, red curve) at 25 °C is also shown. After preincubation (over 120 min at the desired temperature) of the coleoptile segments in the control medium, IAA was added (arrow). The arrow pointing up indicates movement to the left the second phase of the IAA-induced growth and the maximal growth rate that was induced by FC. The inset in Figure 4A shows the total elongation growth (µm cm−1), which was calculated as the sum of the extensions from 3 min interval measurements over 10 h; however, the one in Figure 4B shows the medium pH changes expressed as changes in the H+ concentration per coleoptile segment. The medium pH changes were measured simultaneously with growth (Figure 4A) using the same tissue samples. All of the curves are the means of at least seven independent experiments. Bars indicate ± SE.

Similar articles

Cited by

References

    1. Cleland R.E. Cell wall extension. Annu. Rev. Plant Physiol. 1971;22:197–222. doi: 10.1146/annurev.pp.22.060171.001213. - DOI
    1. Hager A., Menzel H., Krauss A. Versuche und Hypothese zur Primärwirkung des Auxins beim Streckungswachstum. Planta. 1971;100:1–15. doi: 10.1007/BF00386886. - DOI - PubMed
    1. Rayle D.L., Cleland R.E. The acid-growth theory of auxin induced cell elongation is alive and well. Plant Physiol. 1992;99:1271–1274. doi: 10.1104/pp.99.4.1271. - DOI - PMC - PubMed
    1. Kutschera U. The current status of the acid-growth hypothesis. New Phytol. 1994;126:549–569. doi: 10.1111/j.1469-8137.1994.tb02951.x. - DOI
    1. Hager A. Role of the plasma membrane H+-ATPase in auxin-induced elongation growth: Historical and new aspects. J. Plant Res. 2003;116:483–505. doi: 10.1007/s10265-003-0110-x. - DOI - PubMed

LinkOut - more resources