. 2021 May 20;22(10):5365.
doi: 10.3390/ijms22105365.

A Negative Energy Balance Is Associated with Metabolic Dysfunctions in the Hypothalamus of a Humanized Preclinical Model of Alzheimer's Disease, the 5XFAD Mouse

Affiliations

A Negative Energy Balance Is Associated with Metabolic Dysfunctions in the Hypothalamus of a Humanized Preclinical Model of Alzheimer's Disease, the 5XFAD Mouse

Antonio J López-Gambero et al. Int J Mol Sci. .

Abstract

Increasing evidence links metabolic disorders with neurodegenerative processes including Alzheimer's disease (AD). Late AD is associated with amyloid (Aβ) plaque accumulation, neuroinflammation, and central insulin resistance. Here, a humanized AD model, the 5xFAD mouse model, was used to further explore food intake, energy expenditure, neuroinflammation, and neuroendocrine signaling in the hypothalamus. Experiments were performed on 6-month-old male and female full transgenic (Tg5xFAD/5xFAD), heterozygous (Tg5xFAD/-), and non-transgenic (Non-Tg) littermates. Although histological analysis showed absence of Aβ plaques in the hypothalamus of 5xFAD mice, this brain region displayed increased protein levels of GFAP and IBA1 in both Tg5xFAD/- and Tg5xFAD/5xFAD mice and increased expression of IL-1β in Tg5xFAD/5xFAD mice, suggesting neuroinflammation. This condition was accompanied by decreased body weight, food intake, and energy expenditure in both Tg5xFAD/- and Tg5xFAD/5xFAD mice. Negative energy balance was associated with altered circulating levels of insulin, GLP-1, GIP, ghrelin, and resistin; decreased insulin and leptin hypothalamic signaling; dysregulation in main metabolic sensors (phosphorylated IRS1, STAT5, AMPK, mTOR, ERK2); and neuropeptides controlling energy balance (NPY, AgRP, orexin, MCH). These results suggest that glial activation and metabolic dysfunctions in the hypothalamus of a mouse model of AD likely result in negative energy balance, which may contribute to AD pathogenesis development.

Keywords: 5xFAD; Alzheimer’s disease; energy expenditure; hypothalamus; insulin signaling; neuroinflammation.


Conflict of interest statement

C.S. declares he receives a salary from and has shares in the Euronutra company. The remaining authors declare that they have no known competing financial interests or personal relationships that could have appeared to influence the work reported in this paper. The funders had no role in the design of the study; in the collection, analyses, or interpretation of data; in the writing of the manuscript; or in the decision to publish the results.

Figures

Figure 1
Figure 1
Negative energy balance in 5xFAD mice was associated with decreased food intake and energy expenditure for 48 h. (A) Body weight showing significantly decreased body weight in Tg5xFAD/5xFAD males, Tg5xFAD/- females, and Tg5xFAD/5xFAD females at 6 months of age. (B,C) Decreased food intake per body weight in Tg5xFAD/5xFAD males during the day (light phase, 8 a.m. to 8 p.m.) and night (dark phase, 8 p.m. to 8 a.m.). Decreased food intake also occurred in Tg5xFAD/- females and Tg5xFAD/5xFAD females during the night. (DG) Energy expenditure normalized per body weight (EE/BW) in males and females, showing decreased mean EE/BW in Tg5xFAD/5xFAD males during the day, and in g5xFAD/5xFAD females during the day and night. (HK) Respiratory quotient showing decreased ratio of vO2/vCO2 in Tg5xFAD/- females and Tg5xFAD/5xFAD females during the night, indicating decreased glucose utilization/increased fatty acid oxidation as energy source. n = 7–15 per group. Two-way ANOVA analysis with Tukey’s post hoc test: * = p < 0.05, ** = p < 0.01, *** = p < 0.001 versus same-sex non-Tg group; # = p < 0.05, ## = p < 0.01 versus same-sex Tg5xFAD/- group.
Figure 2
Figure 2
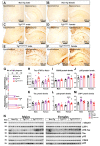
Absence of amyloid-β 42 fragments in hypothalamus of 5xFAD mice at 6 months of age but increased hypothalamic Tau phosphorylation. (AF) Immunohistochemical sections of Aβ42 in the hypothalamus and hippocampus of 5xFAD mice, showing the presence of Aβ42 plaques in hippocampus of Tg5xFAD/- and Tg5xFAD/- males and females, but in the absence in the hypothalamus in all the groups. (G) Quantification of total Aβ plaques in the hypothalamus and hippocampus of 5xFAD mice, showing the absence of Aβ in hypothalamic sections and higher total Aβ content in both male and female Tg5xFAD/5xFAD mice with respect to Tg5xFAD/+ mice. (HM) Densitometric evaluation of Tau activation (Tau-AT8/Tau), CDK5 protein levels, p35 protein levels, Tau protein levels, p25 protein levels, and LRP1 protein levels (n = 5–6 per group). Protein levels were normalized with γ-adaptin. Associated phosphorylations were normalized with respective total protein levels. Non-Tg males were set as 1 for protein relative units. (N): representative Western blot images. Two-way ANOVA analysis with Tukey’s post hoc test: * = p < 0.05, ** = p < 0.01, *** = p < 0.001 versus same-sex non-Tg group; # = p < 0.05 versus same-sex Tg5xFAD/- group.
Figure 3
Figure 3
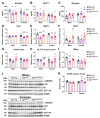
Inflammatory markers were present in the hypothalamus of 5xFAD mice at 6 months of age. (AC) Representative quantification of expression of cytokine genes (TNF-α, IL-1β, IL-6) in hypothalamus assessed by qPCR (n = 5–8 per group). (DF) Representation of Western blot membranes and (G) densitometric evaluation of GFAP, IL-1β, and IBA1 protein levels (n = 5–6 per group). Protein levels were normalized with γ-adaptin. Non-Tg males were set as 1 for relative mRNA units and protein relative units. Two-way ANOVA analysis with Tukey’s post hoc test: * = p < 0.05, ** = p < 0.01, *** = p < 0.001 versus same-sex non-Tg group.
Figure 4
Figure 4
Altered insulin, leptin, and GLP-1 plasma levels and hypothalamic receptors were genotype and sex-specific in 5xFAD mice at 6 months of age. (AC) Plasma levels of insulin, leptin, and GLP-1 (n = 6–7 per group). (DF) Representative quantification of expression of insulin receptor (Insr), leptin receptor (Lepr), and GLP-1 receptor (Glp1r) in hypothalamus assessed by qPCR (n = 5–8 per group). (GI) Representation of Western blot membranes, and (J) densitometric evaluation of insulin receptor (IR) activation (p-IR/IR), leptin receptor (LepR) activation (p-LepR/LepR), and GLP-1 receptor (GLP1R) protein levels (n = 5–6 per group). Protein levels were normalized with γ-adaptin. Associated phosphorylations were normalized with respective total protein levels. Non-Tg males were set as 1 for relative mRNA units and protein relative units. Two-way ANOVA analysis with Tukey’s post hoc test: * = p < 0.05, ** = p < 0.01, *** = p < 0.001 versus same-sex non-Tg group; # = p < 0.05, ## = p < 0.01 versus same-sex Tg5xFAD/- group.
Figure 5
Figure 5
Decreased ghrelin and resistin plasma levels, with hypothalamic receptors being more specific in 5xFAD female mice at 6 months of age. (A,B) Plasma levels of ghrelin and resistin (n = 6–7 per group). (CF) Representative quantification of expression of hypothalamic ghrelin (Ghrl), resistin (Retn), ghrelin receptor (Ghsr), and resistin putative receptor (toll-like receptor 4, Tlr4) assessed by qPCR (n = 5–8 per group). (GH) Representation of Western blot membranes and (I) densitometric evaluation of ghrelin receptor (GHSR) and resistin putative receptor (TLR4) protein levels (n = 5–6 per group). Protein levels were normalized with γ-adaptin. Non-Tg males were set as 1 for relative mRNA units and protein relative units. Two-way ANOVA analysis with Tukey’s post hoc test: * = p < 0.05, ** = p < 0.01, *** = p < 0.001 versus same-sex non-Tg group; # = p < 0.05 versus same-sex Tg5xFAD/- group.
Figure 6
Figure 6
Insulin and leptin hypothalamic signaling were decreased in 5xFAD mice at 6 months of age, as shown by secondary messengers IRS1 and STAT5. (AF) Representation of Western blot membranes and (G) densitometric evaluation of insulin receptor substrate 1 (IRS1) activation ratio (pTyr692-IRS1/pSer612-IRS1), IRS1 protein levels, signal transducer and activator of transcription 5 (STAT5) activation (p-STAT5/STAT5), STAT5 protein levels, STAT3 activation (p-STAT3/STAT3), and STAT3 protein levels (n = 5–6 per group). Protein levels were normalized with γ-adaptin. Associated phosphorylations were normalized per activation/inhibition phosphorylation ratio (IRS1) or respective total protein levels (STAT5 and STAT3). Non-Tg males were set as 1 for protein relative units. Two-way ANOVA analysis with Tukey’s post hoc test: * = p < 0.05, ** = p < 0.01, *** = p < 0.001 versus same-sex non-Tg group; # = p < 0.05, ### = p < 0.001 versus same-sex Tg5xFAD/- group.
Figure 7
Figure 7
Metabolic sensors AMPK, mTOR, and ERK were altered as a consequence of impaired insulin signaling in the hypothalamus of 5xFAD mice at 6 months of age. (AH) Representation of Western blot membranes and (I) densitometric evaluation of AMP kinase (AMPK) activation (p-AMPK/AMPK), AMPK protein levels, mammalian target of rapamycin (mTOR) activation (p-mTOR/mTOR), extracellular-regulated kinase 1 (ERK1) activation (p-ERK1/ERK1), ERK1 protein levels, ERK2 activation (p-ERK2/ERK2), and ERK2 protein levels (n = 5–6 per group). Protein levels were normalized with γ-adaptin. Associated phosphorylations were normalized with respective total protein levels. Non-Tg males were set as 1 for protein relative units. Two-way ANOVA analysis with Tukey’s post hoc test: * = p < 0.05, ** = p < 0.01, *** = p < 0.001 versus same-sex non-Tg group; # = p < 0.05, ## = p < 0.01 versus same-sex Tg5xFAD/- group.
Figure 8
Figure 8
Hypothalamic orexigenic neuropeptide expression was decreased in 5xFAD males accompanied by altered orexin expression in males and MCH expression in females. (AF) Representative quantification of expression of hypothalamic neuropeptide Y (Npy), agouti-related peptide (Agrp), pro-opiomelanocortin (Pomc), cocaine and amphetamine-regulated transcript prepropeptide (Cartpt), orexin (hipocretin; Hcrt), and ppre-melanin concentrating hormone (Pmch) assessed by qPCR (n = 5–8 per group). Non-Tg males were set as 1 for relative mRNA units. Two-way ANOVA analysis with Tukey’s post hoc test: * = p < 0.05, ** = p < 0.01 versus same-sex non-Tg group.
Figure 9
Figure 9
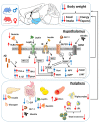
Schematic view of peripheral and hypothalamic alterations derived in negative energy balance and decreased body weight in 5xFAD mice. Increased or decreased observed levels are represented in blue for males and red for females. In the periphery, decreased insulin levels are associated with decreased GIP in males and GLP-1 in females, which are related to decreased body weight pattern. Low leptin levels were observed in males, whereas decreased ghrelin and resistin were more pronounced in females. Females also showed lower total triglyceride and total cholesterol levels, with increased HDL and decreased LDL, contributing to peripheral metabolic impairment. In the hypothalamus, insulin signaling was decreased in 5xFAD mice, accompanied by decreased leptin signaling and resistin hypothalamic levels in females. Despite absence of amyloid plaques, hypothalamic neuroinflammation was observed and contributed to hypothalamic dysfunction and lower body weight. Alterations in NPY/AgRP and orexin (Hcrt) in males seemed to contribute to decreased food intake, whereas females showed a tendency towards decreased overall neuropeptide expression but increased MCH levels. Hypothalamic and peripheral neuroendocrine dysfunction, which are sex-specific and aggravated in the full transgenic (increased Aβ burden) mice, are proposed as contributors to whole negative energy balance in 5RExFAD mice.

Similar articles

Cited by

References

    1. Azzu V., Valencak T.G. Energy Metabolism and Ageing in the Mouse: A Mini-Review. Gerontology. 2017;63:327–336. doi: 10.1159/000454924. - DOI - PubMed
    1. Milstein J.L., Ferris H.A. The brain as an insulin-sensitive metabolic organ. Mol. Metab. 2021:101234. doi: 10.1016/j.molmet.2021.101234. - DOI - PMC - PubMed
    1. López-Gambero A.J., Sanjuan C., Serrano-Castro P.J., Suárez J., Rodríguez de Fonseca F. The Biomedical Uses of Inositols: A Nutraceutical Approach to Metabolic Dysfunction in Aging and Neurodegenerative Diseases. Biomedicines. 2020;8:295. doi: 10.3390/biomedicines8090295. - DOI - PMC - PubMed
    1. Pitt J., Thorner M., Brautigan D., Larner J., Klein W.L. Protection against the synaptic targeting and toxicity of Alzheimer’s-associated Aβ oligomers by insulin mimetic chiro-inositols. FASEB J. 2013;27:199–207. doi: 10.1096/fj.12-211896. - DOI - PMC - PubMed
    1. Talbot K., Wang H.Y., Kazi H., Han L.Y., Bakshi K.P., Stucky A., Fuino R.L., Kawaguchi K.R., Samoyedny A.J., Wilson R.S., et al. Demonstrated brain insulin resistance in Alzheimer’s disease patients is associated with IGF-1 resistance, IRS-1 dysregulation, and cognitive decline. J. Clin. Investig. 2012;122:1316–1338. doi: 10.1172/JCI59903. - DOI - PMC - PubMed

MeSH terms