. 2021 May 20;22(10):5370.
doi: 10.3390/ijms22105370.

Tau Exon 10 Inclusion by PrPC through Downregulating GSK3β Activity

Affiliations

Tau Exon 10 Inclusion by PrPC through Downregulating GSK3β Activity

Laia Lidón et al. Int J Mol Sci. .

Abstract

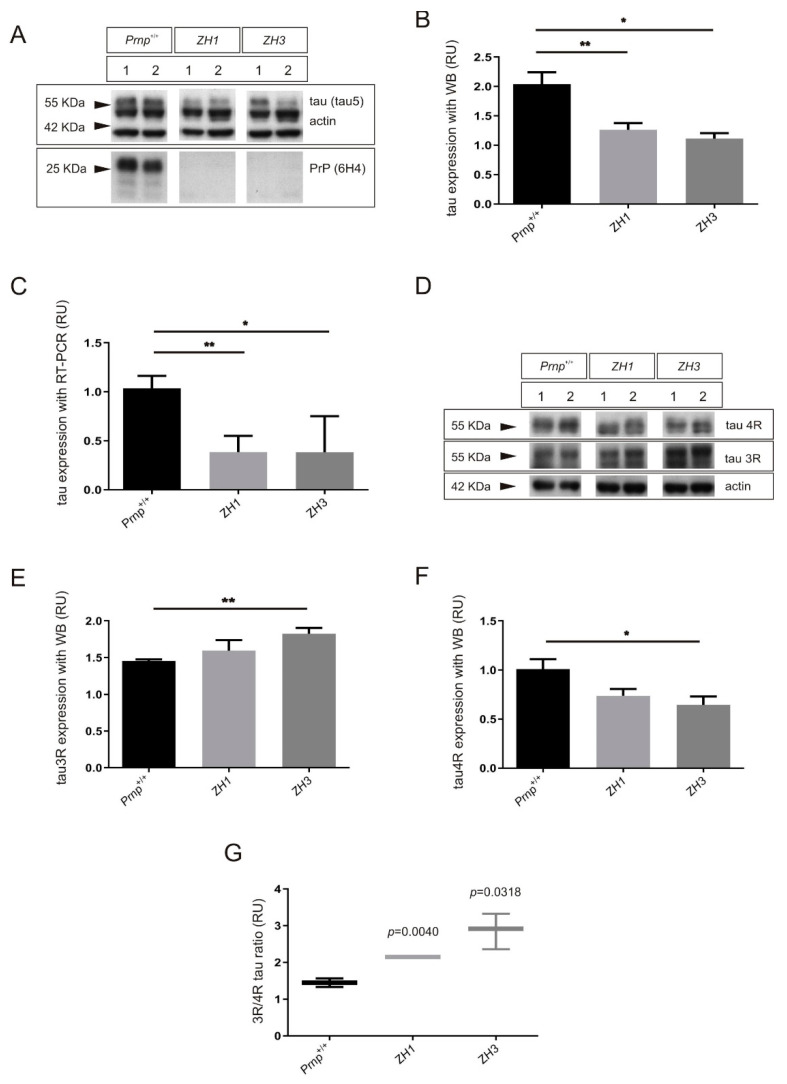
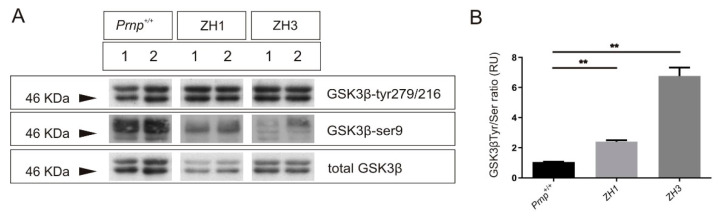
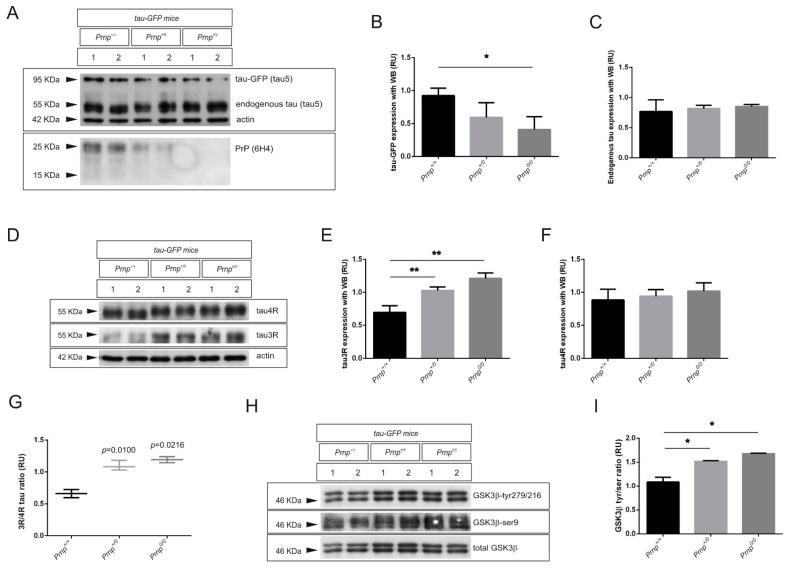
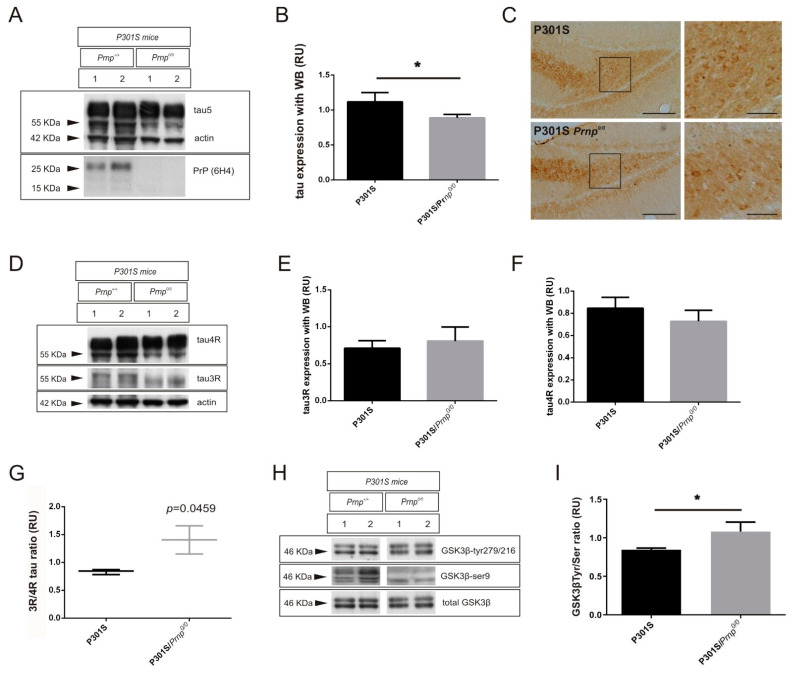
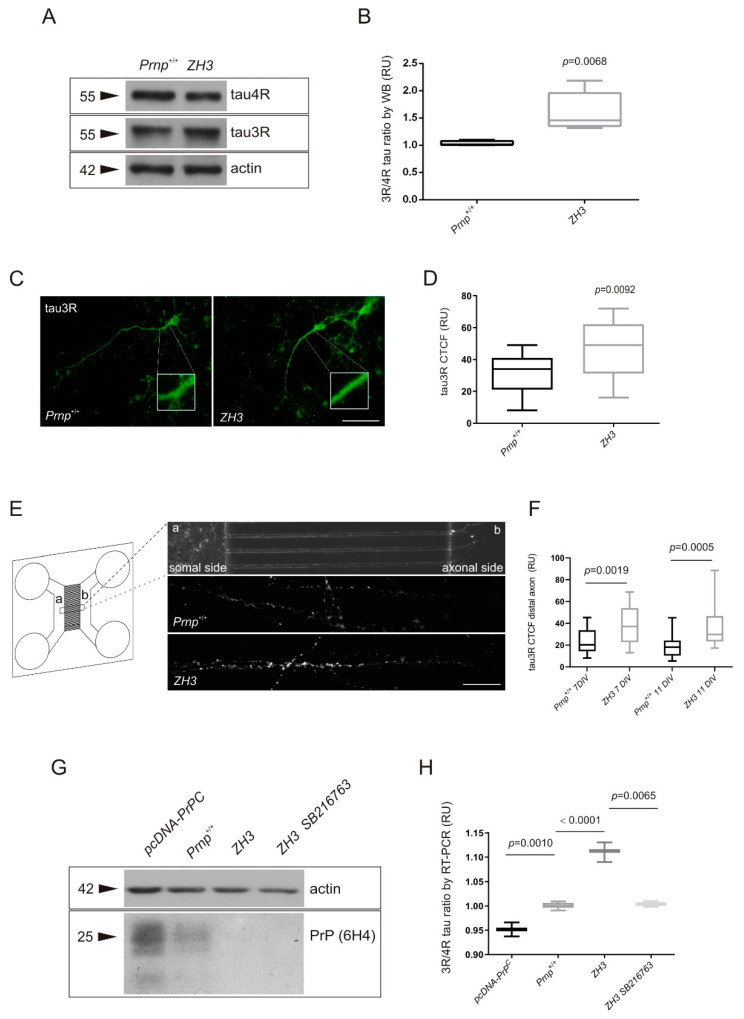
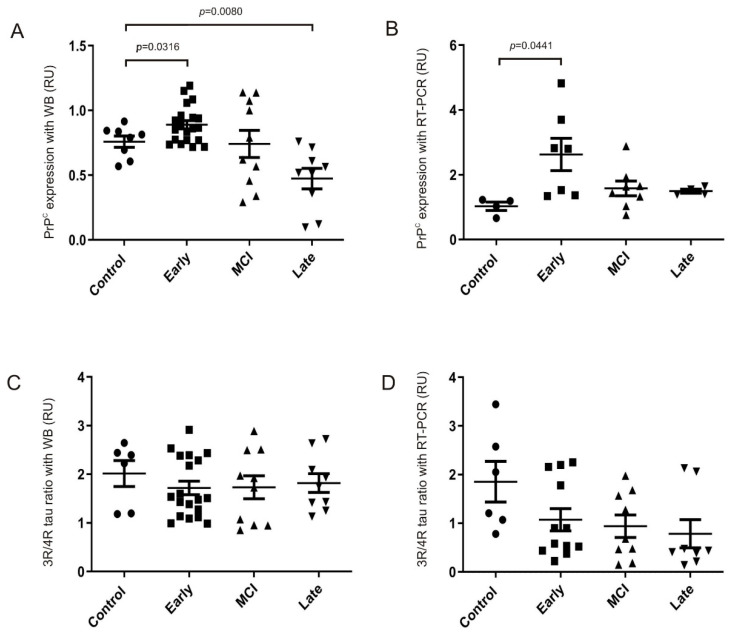
Tau protein is largely responsible for tauopathies, including Alzheimer's disease (AD), where it accumulates in the brain as insoluble aggregates. Tau mRNA is regulated by alternative splicing, and inclusion or exclusion of exon 10 gives rise to the 3R and 4R isoforms respectively, whose balance is physiologically regulated. In this sense, one of the several factors that regulate alternative splicing of tau is GSK3β, whose activity is inhibited by the cellular prion protein (PrPC), which has different physiological functions in neuroprotection and neuronal differentiation. Moreover, a relationship between PrPC and tau expression levels has been reported during AD evolution. For this reason, in this study we aimed to analyze the role of PrPC and the implication of GSK3β in the regulation of tau exon 10 alternative splicing. We used AD human samples and mouse models of PrPC ablation and tau overexpression. In addition, we used primary neuronal cultures to develop functional studies. Our results revealed a paralleled association between PrPC expression and tau 4R isoforms in all models analyzed. In this sense, reduction or ablation of PrPC levels induces an increase in tau 3R/4R balance. More relevantly, our data points to GSK3β activity downstream from PrPC in this phenomenon. Our results indicate that PrPC plays a role in tau exon 10 inclusion through the inhibitory capacity of GSK3β.

Keywords: Alzheimer’s disease; GSK3β; alternative splicing; cellular prion protein; microtubule-associated protein tau; tauopathies.


Conflict of interest statement

The authors declare no conflict of interest.

Figures

Figure 1
Figure 1
Effects on tau and its alternative exon 10 isoforms in mice devoid of PrPC expression. (AC) Total tau expression analyzed in brain extract from WT and Prnp0/0 mice ZH1 or ZH3 at the age of 3 months. (A) Representative WB analysis using total anti-tau antibody (monoclonal Tau5) in parallel with anti-PrPC antibody (monoclonal 6H4) in each case. Actin detection was used as control loading protein. (B) Histograms showing the densitometry study of tau expression in each genotype. (C) Histograms showing the RT-qPCR analysis of expression of tau in mice analyzed in (A). (DG) 3R and 4R tau isoform expression analyzed in brain extract from WT and Prnp0/0 mice ZH1 or ZH3 at the age of 3 months. (D) Representative WB analysis using anti-3R tau antibody (monoclonal RD3) in parallel with anti-4R tau antibody (monoclonal RD4) in each genotype. Actin detection was used as control loading protein. (E,F) Histograms showing the densitometry study of 3R tau (E) or 4R tau (F) expression in each genotype. (G) Graphical representation of the 3R/4R tau ratio analyzed with data represented in (E,F). Between 3 and 5 mice were examined in each group and data represents the mean ± S.E.M. Differences between groups were considered statistically significant at ** p < 0.01 and * p < 0.05 (t-test).
Figure 2
Figure 2
GSK3β activity in mice devoid of PrPC expression. (A,B) GSK3β activation analyzed by WB in brain extract from WT and Prnp0/0 mice ZH1 or ZH3 at the age of 3 months. (A) Representative WB analysis using anti-phospho-tyr279/216 GSK3 antibody (monoclonal 5G-2F) in parallel with anti-phospho-ser9 GSK3 antibody (monoclonal 2D3) in each case. Membranes were re-probed with antibody against total GSK3 (monoclonal 4G-1E) for protein standardization. (B) Histograms showing the quantified ratio between phospho-tyr279/216 and phospho-ser9 after densitometry analysis of both phosphorylated GSK3β epitopes in each genotype, which represents the kinase activity. n = 3 mice were examined in each group and data represent the mean ± S.E.M. Differences between groups were considered statistically significant at ** p < 0.01 (t-test).
Figure 3
Figure 3
Effects on tau, alternative exon 10 forms, and GSK3β in tau transgenic mice overexpressing tau-GFP after ablation of PrPC expression. (AC) Total tau expression analyzed in brain extract from tau-GFP, tau-GFP-Prnp+/0, and tau-GFP-Prnp0/0 mice at the age of 3 months. (A) Representative WB analysis using total anti-tau antibody (monoclonal Tau5) in parallel with anti-PrPC antibody (monoclonal 6H4) in each case. Actin detection was used as control loading protein. (B) Histograms showing the densitometry study of tau-GFP expression in each genotype. (C) Histograms showing the densitometry study of endogenous tau expression in each genotype. (DG) Endogenous 3R and 4R tau isoforms expression analyzed in brain extract from tau-GFP, tau-GFP-Prnp+/0, and tau-GFP-Prnp0/0 mice at the age of 3 months. (D) Representative WB analysis using anti-3R tau antibody (monoclonal RD3) in parallel with anti-4R tau antibody (monoclonal RD4) in each genotype. Actin detection was used as control loading protein. (E,F) Histograms showing the densitometry study of 3R tau (E) and 4R tau (F) expression in each genotype. (G) Graphical representation of the 3R/4R tau ratio analyzed with data represented in (E,F). (H,I) GSK3β activation analyzed with WB in brain extract from tau-GFP, tau-GFP- Prnp+/0, and tau-GFP-Prnp0/0 mice at the age of 3 months. (H) Representative WB analysis using anti-phospho-tyr279/216 GSK3 antibody (monoclonal 5G-2F) in parallel with anti-phospho-ser9 GSK3 antibody (monoclonal 2D3) in each case. Membranes were re-probed with antibody against total GSK3 (monoclonal 4G-1E) for protein standardization. (I) Histograms showing the quantified ratio between phospho-tyr279/216 and phospho-ser9 after densitometry analysis of both phosphorylated GSK3β epitopes in each genotype, which represents the kinase activity. n = 3 mice were examined in each group and data represents the mean ± S.E.M. Differences between groups were considered statistically significant at ** p < 0.01 and * p < 0.05 (t-test).
Figure 4
Figure 4
Effects on tau, alternative exon 10 forms, and GSK3β in tau transgenic mice overexpressing human P301S MAPT mutation after ablation of PrPC expression. (AC) Total tau expression analyzed in brain extract from P301S and P301S-Prnp0/0 mice at the age of 3 months. (A) Representative WB analysis using total anti-tau antibody (monoclonal Tau5) in parallel with anti-PrPC antibody (monoclonal 6H4) in each case. Actin detection was used as control loading protein. (B) Histograms showing the densitometry study of both endogenous and overexpressed tau expression in each genotype. (C) Immunohistochemical detection of total tau in mouse brain sections from P301S and P301S-Prnp0/0. Monoclonal tau5 antibody was used to detect increased immunoreaction in DG from P301S in contrast to P301S-Prnp0/0 animals. Scale bars = 100 µm and 50 µm. (DG) Endogenous 3R and 4R tau isoform expression analyzed in brain extract from P301S and P301S-Prnp0/0 mice at the age of 3 months. (D) Representative WB analysis using anti-3R tau antibody (monoclonal RD3) in parallel with anti-4R tau antibody (monoclonal RD4) in each genotype. Actin detection was used as control loading protein. (E,F) Histograms showing the densitometry study of 3R tau (E) and 4R tau (F) expression in each genotype. (G) Graphical representation of the 3R/4R tau ratio analyzed with data represented in (E,F). (H,I) GSK3β activation analyzed with WB in brain extract from P301S and P301S-Prnp0/0 mice at the age of 3 months. (H) Representative WB analysis using anti-phospho-tyr279/216 GSK3 antibody (monoclonal 5G-2F) in parallel with anti-phospho-ser9 GSK3 antibody (monoclonal 2D3) in each case. Membranes were re-probed with antibody against total GSK3 (monoclonal 4G-1E) for protein standardization. (I) Histograms showing the quantified ratio between phospho-tyr279/216 and phospho-ser9 after densitometry analysis of both phosphorylated GSK3β epitopes in each genotype, which represents the kinase activity. n = 3 mice were examined in each group and data represents the mean ± S.E.M. Differences between groups were considered statistically significant at * p < 0.05 (t-test).
Figure 5
Figure 5
Effects on alternative exon 10 tau splicing downstream GSK3β activity in cortical cultures from WT and ZH3 mice depending on GSK3β activity condition. (AF) 3R and 4R tau isoform expression analyzed in cortical primary cultures from WT (Prnp+/+) and Prnp0/0 (ZH3) mice. (A) Representative WB analysis using anti-3R tau antibody (monoclonal RD3) in parallel with anti-4R tau antibody (monoclonal RD4) in primary cultures from each genotype at 7 DIV. Actin detection was used as control loading protein. (B) Graphical representation of the 3R/4R tau ratio analyzed in n = 3 independent primary cultures from each genotype. (C) Representative immunocytochemical detection of 3R tau isoforms in neurites of cultured neurons from Prnp+/+ and ZH3 mice at 7 DIV. Monoclonal RD3 antibody was used to detect an increased immunoreaction in ZH3 in contrast to Prnp+/+ animals. The square represents the proximal neurite region used to quantify fluorescence. Scale bar = 50 µm. (D) CTCF values derived from immunofluorescence microphotographs of 3R tau expression in neurites derived from cultured neurons of Prnp+/+ and ZH3 mice. The mean ± S.E.M. from each genotype was obtained after quantifying three different points inside the square of the image from n = 4 neurons for each culture. (E) Representation of the PDMS devices used to isolate axons of cultured neurons from Prnp+/+ and ZH3 mice at 7 and 11 DIV (see the somal side (a reservoir) and axonal side (b reservoir) and magnified examples of 3R tau-labelled at the axonal side at 7 DIV). Scale bar = 25 µm. (F) CTCF values derived from immunofluorescence microphotographs of 3R tau expression in distal axons shown in (E) and derived from cultured neurons of Prnp+/+ and ZH3 mice. The mean ± S.E.M. from each genotype and DIV was obtained after quantifying one to five individual axons from ten microphotographs. (G,H) Changes in 3R and 4R tau isoform expression analyzed in cortical primary cultures from WT (Prnp+/+) and Prnp0/0 (ZH3) mice at 7 DIV. (G) Representative WB analysis using anti-PrPC antibody (monoclonal 6H4) in primary cultures after modifying GSK3β activity by overexpressing PrPC or use of the GSK3β inhibitor SB-216763. Actin detection was used as a control loading protein. (H) Graphical representation of the 3R/4R tau ratio analyzed from n = 3 independent primary cultures from each GSK3β activity condition. p values indicating statistical differences between groups were determined using t test.
Figure 6
Figure 6
Expression of PrPC and splicing exon 10 isoforms of tau in AD brains according to Braak stage. (A,B) Plots illustrating PrPC expression by WB using anti-PrPC antibody (monoclonal 6H4). Actin detection was used as a control loading protein (A) or RT-PCR (B) in cases shown in Table 1 and grouped as Non-AD, Initial (Braak I-II), Intermediate (Braak III-IV), or Late AD (Braak V-VI). (C,D) Plots illustrating the ratio between 3R and 4R tau isoforms with WB analysis with RD3 and RD4 antibodies and using actin as control loading protein (C) or RT-PCR (D) in cases shown in Table 1. Each dot corresponds to one sample and the mean ± S.E.M. for each group is also displayed.

Similar articles

Cited by

References

    1. Avila J. Tau aggregation into fibrillar polymers: Tauopathies. FEBS Lett. 2000;476:89–92. doi: 10.1016/S0014-5793(00)01676-8. - DOI - PubMed
    1. Kovacs G.G. Invited review: Neuropathology of tauopathies: Principles and practice. Neuropathol. Appl. Neurobiol. 2015;41:3–23. doi: 10.1111/nan.12208. - DOI - PubMed
    1. Lee V.M., Goedert M., Trojanowski J.Q. Neurodegenerative tauopathies. Annu. Rev. Neurosci. 2001;24:1121–1159. doi: 10.1146/annurev.neuro.24.1.1121. - DOI - PubMed
    1. Buee L., Delacourte A. Comparative biochemistry of tau in progressive supranuclear palsy, corticobasal degeneration, FTDP-17 and Pick’s disease. Brain Pathol. 1999;9:681–693. doi: 10.1111/j.1750-3639.1999.tb00550.x. - DOI - PMC - PubMed
    1. Lowe J., Kalaria R. Dementia. In: Love S., Budka H., Ironside J., Perry A., editors. Greenfield’s Neuropathology. 9th ed. CRC Press; Boca Raton, FL, USA: 2015. pp. 858–973.

MeSH terms