. 2021 May 20;11(5):372.
doi: 10.3390/membranes11050372.

Simulations on Simple Models of Connexin Hemichannels Indicate That Ca2+ Blocking Is Not a Pure Electrostatic Effect

Affiliations

Simulations on Simple Models of Connexin Hemichannels Indicate That Ca2+ Blocking Is Not a Pure Electrostatic Effect

Felipe Villanelo et al. Membranes (Basel). .

Abstract

Connexin hemichannels allow the unspecific but regulated interchange of molecules from ions to second messenger and ATP, between the eukariotic cell and its extracellular space. The transport of ions and water through hemichannels is important for physiological functions and also in the progression of several pathological conditions. Extracellular Ca2+ concentration is one of the regulators that drives the channel to a closed state. However the relation between their functional and structural states is far for being totally understood. In this work, we modelled connexin hemichannels using simple systems based on a fixed array of carbon atoms and assess the Ca2+ regulation using molecular dynamics simulations. The two proposed mechanism described so far for calcium action were studied combined, e.g., an electrostatic effect and a pore stretching. Our results show that the addition of positive charge density inside the channel cannot stop the flow of potassium, chloride nor water. Only a pore stretching at the center of the pore can explain the channel blocking.

Keywords: calcium-binding; connexin; hemichannel; simulation.


Conflict of interest statement

The authors declare no conflict of interest. The funders had no role in the design of the study; in the collection, analyses, or interpretation of data; in the writing of the manuscript, or in the decision to publish the results.

Figures

Figure 1
Figure 1
General scheme comparing the simple HC model (Panel A) with respect to the full-atom model of Cx26-HC embedded in a phospholipid bilayer (Panel B). (A) White spheres represent sp2 carbon atoms; yellow spheres represent CaLPs; pink spheres represent the atoms subjected to radius alteration; red and blue spheres represent negative and positive charged dummy-carbons particles, respectively (see text for detail). (B) Membrane atoms are represented as black spheres; yellow spheres represent calcium atoms; grey surface is the HC protein surface, red and blue surface represent negative and positive residues. The upper region of both models is equivalent to the extracellular side.
Figure 2
Figure 2
Ion and water permeation events during simulations at V = 500 mV. (A,E) Potassium permeation. (B,F) Chloride permeation. (C,G) Water permeation exterior to interior. (D,H) Water permeation interior to exterior. In the first column (from AC) permeation is plotted against pore diameter, while each color represent a different CaLP charge magnitude. In the second column (from DF) permeation is plotted against CaLP charge magnitude, while each color represent a different pore diameter. Legends are indicated in the first plot of each column. All the values are average over three replicas ± SD.
Figure 3
Figure 3
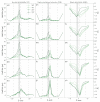
Ion and water distribution across z-axis. Red lines (left column) correspond to chloride ion density. Blue lines (center column) correspond to potassium ion density. Green lines (right column) correspond to water molecules density (OH2 atom). Density is normalized against the area under the curve. Each subplot from top to bottom correpond to different pore diameter at the center of the channel in the following order: (A,F,K) 13 Å; (B,G,L) 11 Å; (C,H,M) 9 Å; (D,I,N) 7 Å; and (E,J,O) 5 Å. Each line in each subplot correspond to different CaLP charge magnitude as shown in legend in the top subplot. Solid lines are average over three replicas and shades around lines are SD.
Figure 4
Figure 4
Ion and water radial distribution in all the systems tested. (AE) System X0. (FJ) System X1. (KO) System X2. (PT) System X3. (A,F,K,P) System with 13 Å central diameter. (B,G,L,Q) System with 11 Å central diameter. (C,H,M,R) System with 9 Å central diameter. (D,I,N,S) System with 7 Å central diameter. (E,J,O,T) System with 5 Å central diameter. In all plots, red lines is for chloride, blue lines for potassium and green lines for water (OH2 atom). Density is normalized against the area under the curve.
Figure 5
Figure 5
Properties of water molecules during simulations. (AE) Half life of decay of survival probability (SP). (FJ) Half life of decay of dipole orientational relaxation (DOR). (KO) Orientation of water dipole (DZ) along the pore axis (WdO). (A,F,K) System with 13 Å central diameter. (B,G,L) System with 11 Å central diameter. (C,H,M) System with 9 Å central diameter. (D,I,N) System with 7 Å central diameter. (E,J,O) System with 5 Å central diameter. Dotted lines represent the limits of the channel and the grey shade indicate the position of CaLP. All the values are average over three replicas ± SD when shown.

Similar articles

Cited by

  • Calcium Regulation of Connexin Hemichannels.
    Bayraktar E, Lopez-Pigozzi D, Bortolozzi M. Bayraktar E, et al. Int J Mol Sci. 2024 Jun 15;25(12):6594. doi: 10.3390/ijms25126594. Int J Mol Sci. 2024. PMID: 38928300 Free PMC article. Review.

References

    1. García I.E., Prado P., Pupo A., Jara O., Rojas-Gómez D., Mujica P., Flores-Muñoz C., González-Casanova J., Soto-Riveros C., Pinto B.I., et al. Connexinopathies: A structural and functional glimpse. BMC Cell Biol. 2016;17:71–87. doi: 10.1186/s12860-016-0092-x. - DOI - PMC - PubMed
    1. Srinivas M., Verselis V.K., White T.W. Human diseases associated with connexin mutations. Biochim. Biophys. Acta Biomembr. 2018;1860:192–201. doi: 10.1016/j.bbamem.2017.04.024. - DOI - PMC - PubMed
    1. Aasen T., Mesnil M., Naus C.C., Lampe P.D., Laird D.W. Gap junctions and cancer: Communicating for 50 years. Nat. Rev. Cancer. 2016:775–788. doi: 10.1038/nrc.2016.105. - DOI - PMC - PubMed
    1. García-Dorado D., Rodríguez-Sinovas A., Ruiz-Meana M. Gap junction-mediated spread of cell injury and death during myocardial ischemia-reperfusion. Cardiovasc. Res. 2004;61:386–401. doi: 10.1016/j.cardiores.2003.11.039. - DOI - PubMed
    1. Hernández-Guerra M., Hadjihambi A., Jalan R. Gap junctions in liver disease: Implications for pathogenesis and therapy. J. Hepatol. 2019;70:759–772. doi: 10.1016/j.jhep.2018.12.023. - DOI - PubMed

LinkOut - more resources