

The Use of Response Surface Methodology as a Statistical Tool for the Optimisation of Waste and Pure Canola Oil Biodegradation by Antarctic Soil Bacteria
- PMID: 34065265
- PMCID: PMC8161070
- DOI: 10.3390/life11050456
The Use of Response Surface Methodology as a Statistical Tool for the Optimisation of Waste and Pure Canola Oil Biodegradation by Antarctic Soil Bacteria
Abstract
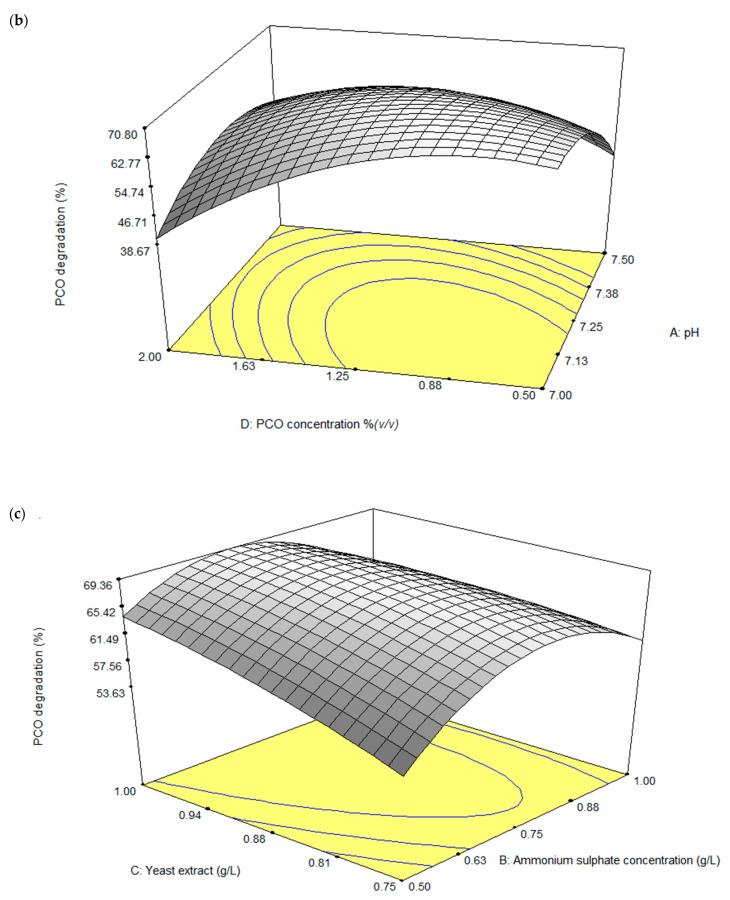
Hydrocarbons can cause pollution to Antarctic terrestrial and aquatic ecosystems, both through accidental release and the discharge of waste cooking oil in grey water. Such pollutants can persist for long periods in cold environments. The native microbial community may play a role in their biodegradation. In this study, using mixed native Antarctic bacterial communities, several environmental factors influencing biodegradation of waste canola oil (WCO) and pure canola oil (PCO) were optimised using established one-factor-at-a-time (OFAT) and response surface methodology (RSM) approaches. The factors include salinity, pH, type of nitrogen and concentration, temperature, yeast extract and initial substrate concentration in OFAT and only the significant factors proceeded for the statistical optimisation through RSM. High concentration of substrate targeted for degradation activity through RSM compared to OFAT method. As for the result, all factors were significant in PBD, while only 4 factors were significant in biodegradation of PCO (pH, nitrogen concentration, yeast extract and initial substrate concentration). Using OFAT, the most effective microbial community examined was able to degrade 94.42% and 86.83% (from an initial concentration of 0.5% (v/v)) of WCO and PCO, respectively, within 7 days. Using RSM, 94.99% and 79.77% degradation of WCO and PCO was achieved in 6 days. The significant interaction for the RSM in biodegradation activity between temperature and WCO concentration in WCO media were exhibited. Meanwhile, in biodegradation of PCO the significant factors were between (1) pH and PCO concentration, (2) nitrogen concentration and yeast extract, (3) nitrogen concentration and PCO concentration. The models for the RSM were validated for both WCO and PCO media and it showed no significant difference between experimental and predicted values. The efficiency of canola oil biodegradation achieved in this study provides support for the development of practical strategies for efficient bioremediation in the Antarctic environment.
Keywords: Antarctic bacterial consortium; one-factor-at-a-time; pure canola oil; response surface methodology; waste canola oil.
Conflict of interest statement
The authors declare no conflict of interest.
Figures


Similar articles
-
Mathematical Modelling of Canola Oil Biodegradation and Optimisation of Biosurfactant Production by an Antarctic Bacterial Consortium Using Response Surface Methodology.Foods. 2021 Nov 14;10(11):2801. doi: 10.3390/foods10112801. Foods. 2021. PMID: 34829082 Free PMC article.
-
Statistical Optimisation of Diesel Biodegradation at Low Temperatures by an Antarctic Marine Bacterial Consortium Isolated from Non-Contaminated Seawater.Microorganisms. 2021 Jun 3;9(6):1213. doi: 10.3390/microorganisms9061213. Microorganisms. 2021. PMID: 34205164 Free PMC article.
-
Growth Optimisation and Kinetic Profiling of Diesel Biodegradation by a Cold-Adapted Microbial Consortium Isolated from Trinity Peninsula, Antarctica.Biology (Basel). 2021 Jun 2;10(6):493. doi: 10.3390/biology10060493. Biology (Basel). 2021. PMID: 34199334 Free PMC article.
-
Microbial degradation of hydrocarbons in the environment.Microbiol Rev. 1990 Sep;54(3):305-15. doi: 10.1128/mr.54.3.305-315.1990. Microbiol Rev. 1990. PMID: 2215423 Free PMC article. Review.
-
The role of microorganisms in petroleum degradation: Current development and prospects.Sci Total Environ. 2023 Mar 20;865:161112. doi: 10.1016/j.scitotenv.2022.161112. Epub 2022 Dec 28. Sci Total Environ. 2023. PMID: 36586680 Review.
Cited by
-
Optimized Protocol for Microalgae DNA Staining with SYTO9/SYBR Green I, Based on Flow Cytometry and RSM Methodology: Experimental Design, Impacts and Validation.Methods Protoc. 2022 Sep 27;5(5):76. doi: 10.3390/mps5050076. Methods Protoc. 2022. PMID: 36287048 Free PMC article.
-
Biodegradation of various edible oils and fat by Staphylococcus petrasii sub sp. jettensis VSJK R1 for application in bioremediation of lipid rich restaurant wastewater.Braz J Microbiol. 2025 Mar;56(1):1-10. doi: 10.1007/s42770-024-01577-7. Epub 2024 Dec 4. Braz J Microbiol. 2025. PMID: 39630219
-
The Optimization of Avocado-Seed-Starch-Based Degradable Plastic Synthesis with a Polylactic Acid (PLA) Blend Using Response Surface Methodology (RSM).Polymers (Basel). 2024 Aug 22;16(16):2384. doi: 10.3390/polym16162384. Polymers (Basel). 2024. PMID: 39204603 Free PMC article.
-
New Perspectives to Enhance Wastes and By-Products from Agro-Food Processing.Foods. 2023 Nov 7;12(22):4057. doi: 10.3390/foods12224057. Foods. 2023. PMID: 38002114 Free PMC article.
-
Mathematical Modelling of Canola Oil Biodegradation and Optimisation of Biosurfactant Production by an Antarctic Bacterial Consortium Using Response Surface Methodology.Foods. 2021 Nov 14;10(11):2801. doi: 10.3390/foods10112801. Foods. 2021. PMID: 34829082 Free PMC article.
References
-
- Shahbandeh M. Vegetable Oils: Production Worldwide 2012/13–2019/20, by Type. [(accessed on 15 July 2020)];2020 Available online: https://www.statista.com/statistics/263933/production-of-vegetable-oils-....
-
- Gunstone F.D. Vegetable Oils in Foods Technology: Composition, Properties and Uses. Blackwell Publishing Ltd.; Hoboken, NJ, USA: 2002. pp. 107–133.
-
- Ananey-Obiri D., Matthews L., Azahrani M.H., Ibrahim S.A., Galanakis C.M., Tahergorabi R. Application of protein-based edible coatings for fat uptake reduction in deep-fat fried foods with an emphasis on muscle food proteins. Trends Food Sci. Technol. 2018;80:167–174. doi: 10.1016/j.tifs.2018.08.012. - DOI
-
- Australia Antarctic Division Pollution and Waste. Department of the Environment and Energy. [(accessed on 12 December 2018)];2012 Available online: https://www.antarctica.gov.au.
Grants and funding
- GPM‒2018/9660000, GPM‒2019/9678900, 2017/9300436/Universiti Putra Malaysia
- YPASM Smart Partnership Initiative (6300247)/Sultan Mizan Antarctic Research Foundation (YPASM)
- BAS 'Biodiversity, Ecosystems and Adaptation' Team/Natural Environment Research Council
- CIMAA/Centro de Investigacion y Monitoreo Ambiental Antàrctico
LinkOut - more resources
Full Text Sources
Research Materials
