. 2021 May 20;22(10):5379.
doi: 10.3390/ijms22105379.

Rapamycin Ameliorates Defects in Mitochondrial Fission and Mitophagy in Glioblastoma Cells

Affiliations

Rapamycin Ameliorates Defects in Mitochondrial Fission and Mitophagy in Glioblastoma Cells

Paola Lenzi et al. Int J Mol Sci. .

Abstract

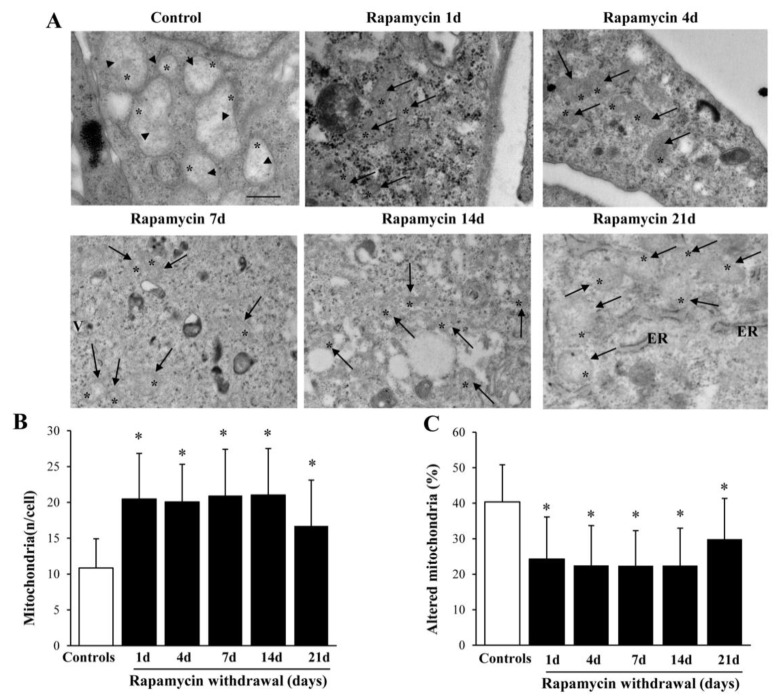
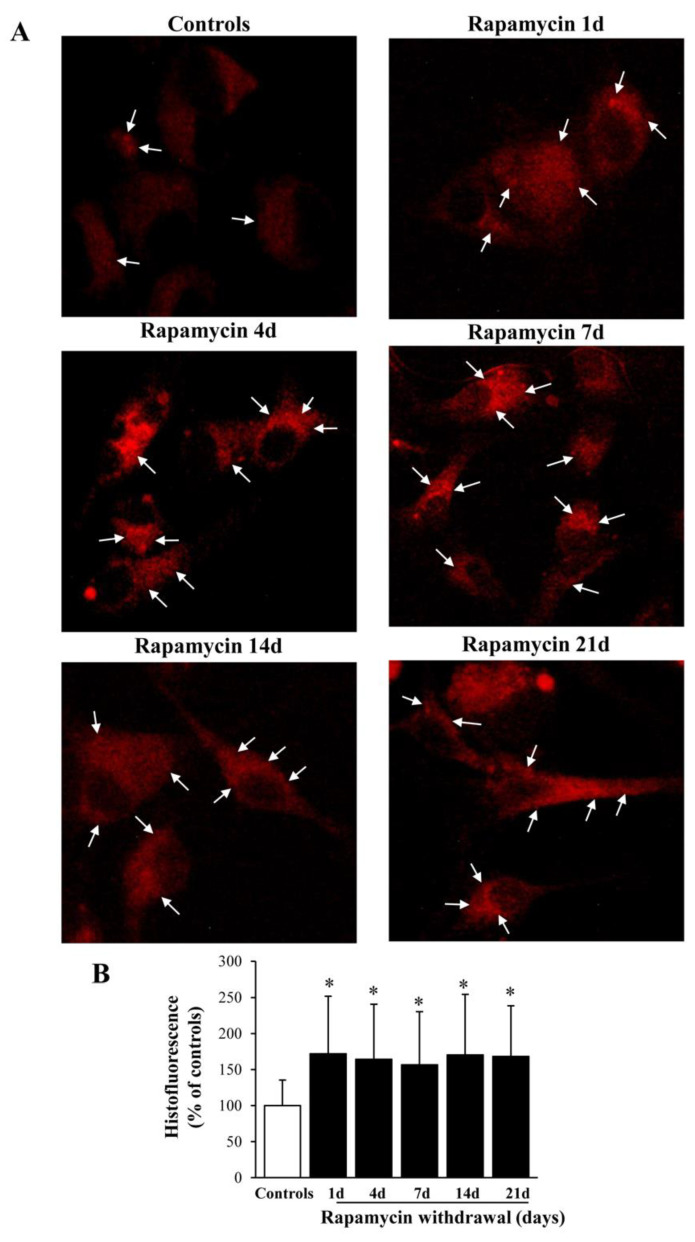
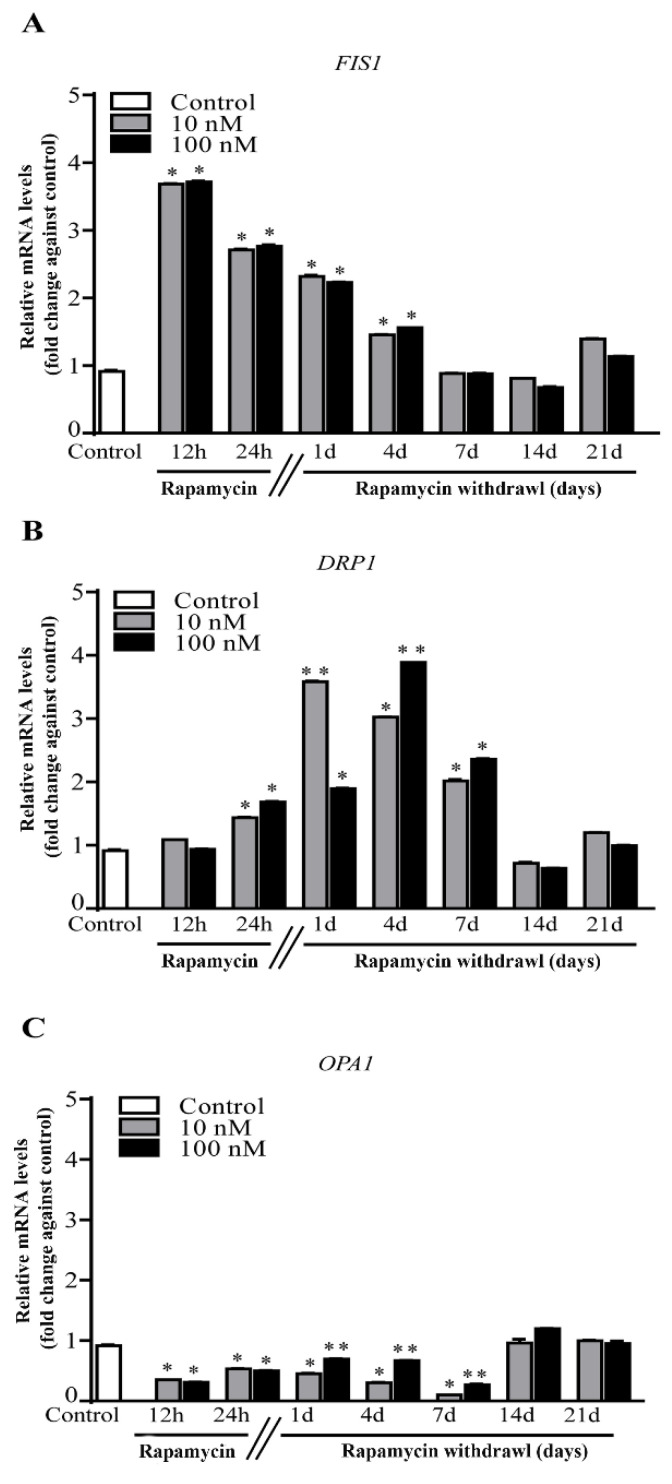
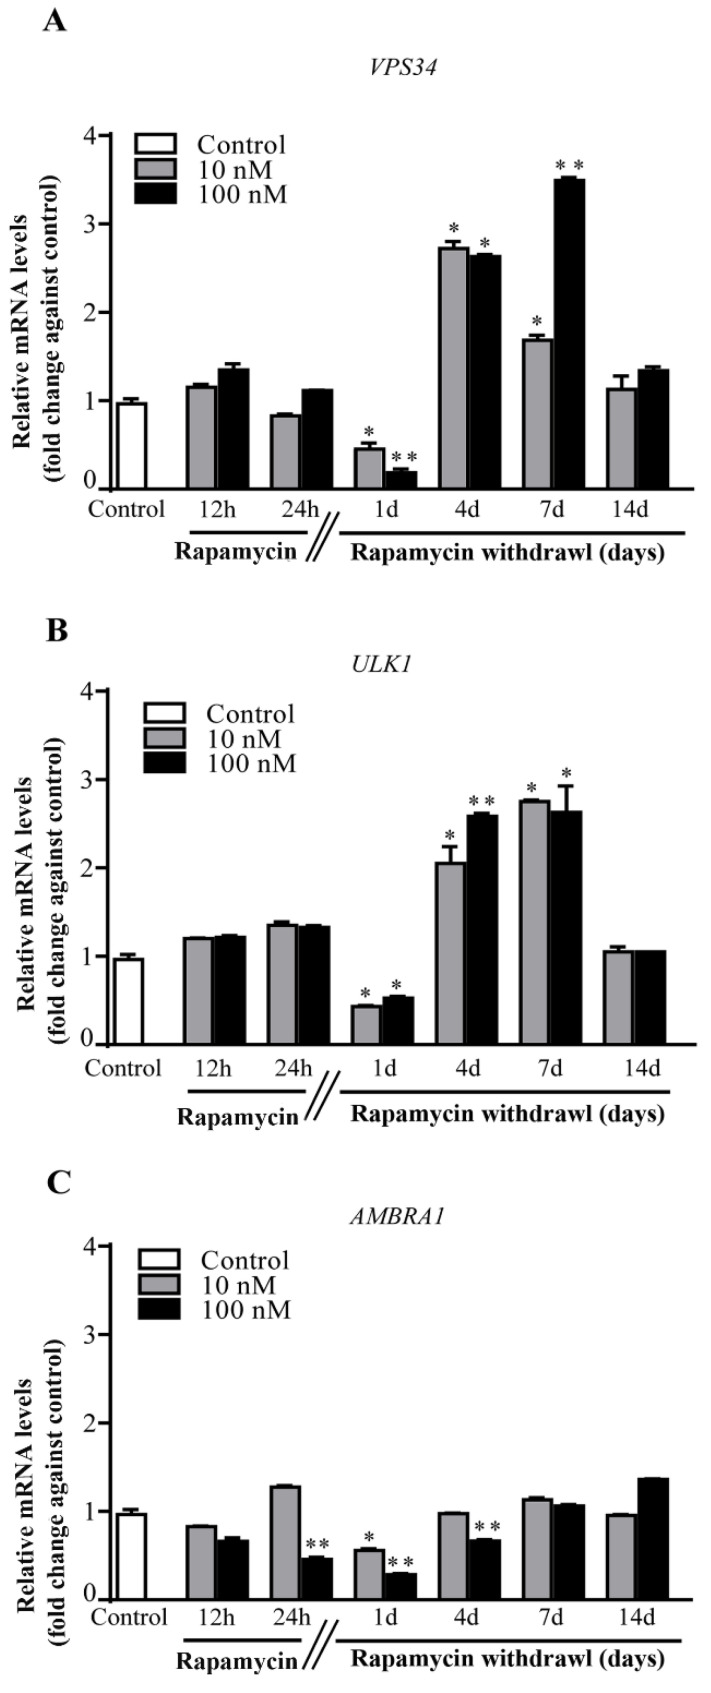
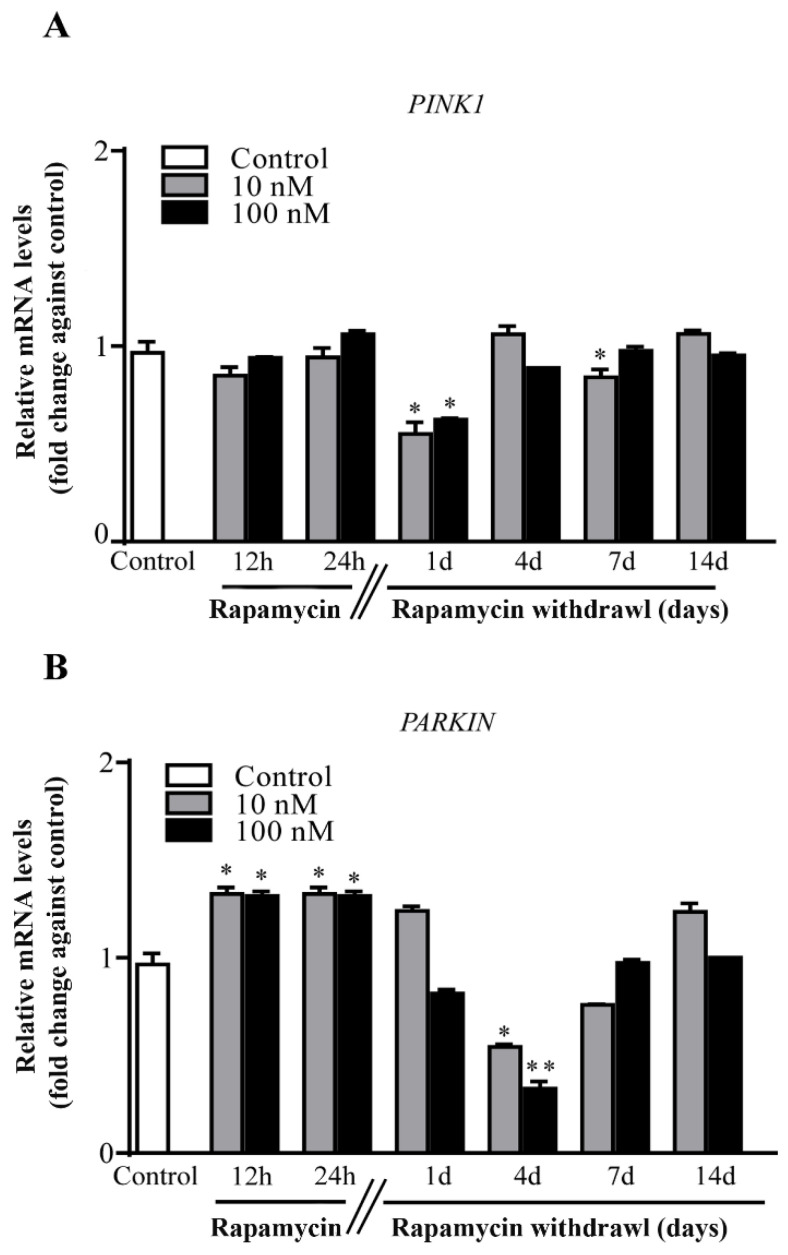
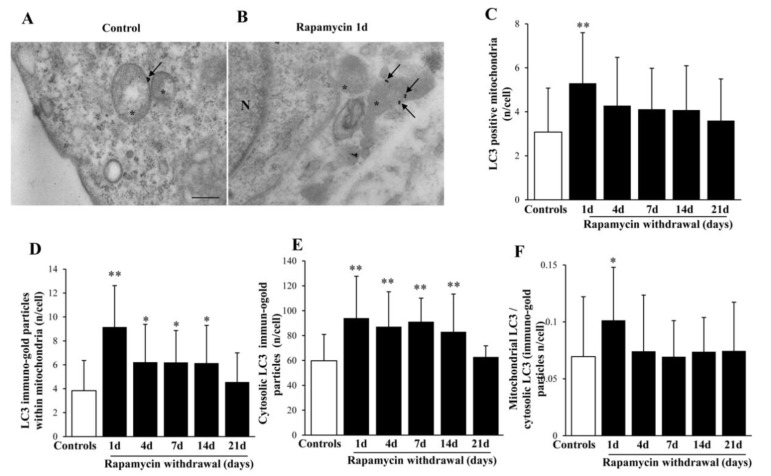
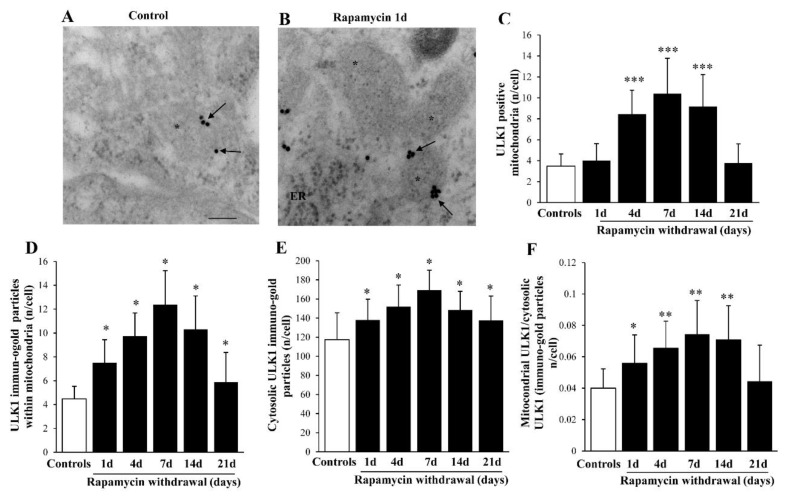
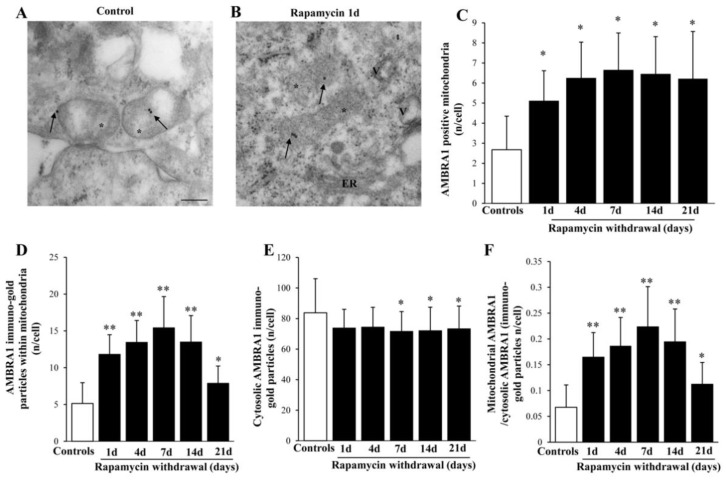
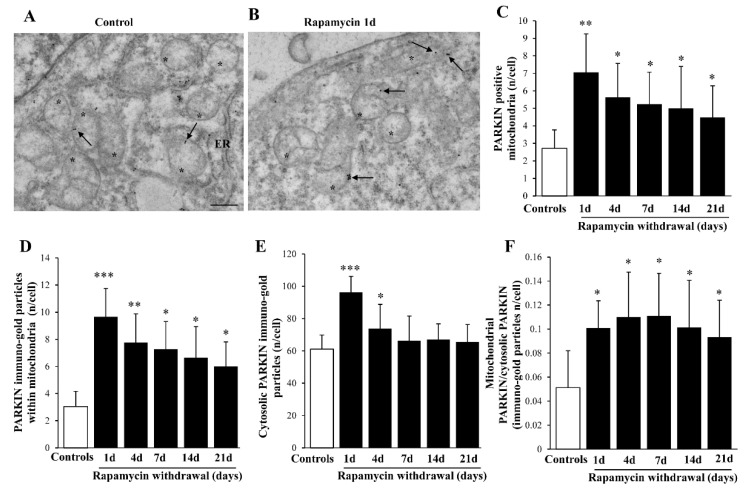
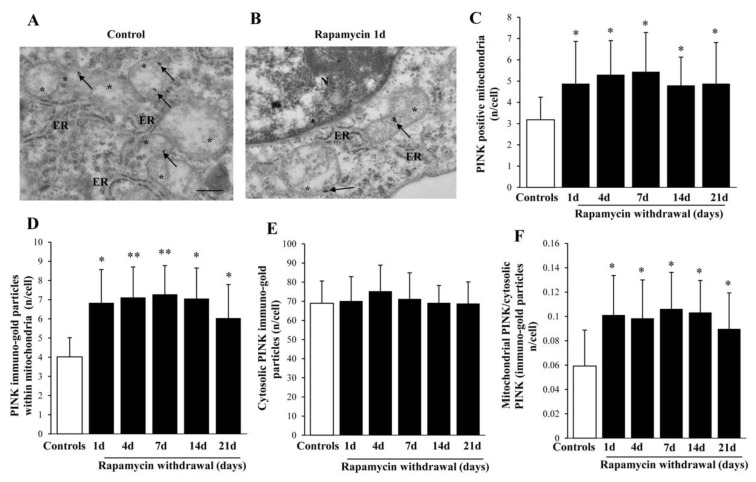
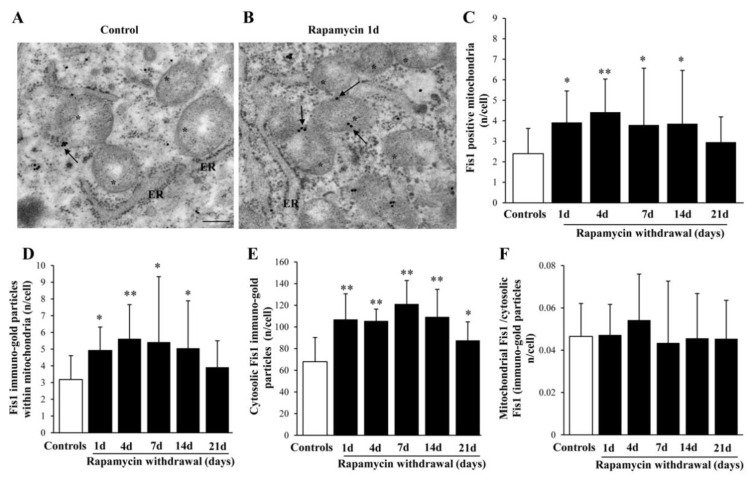
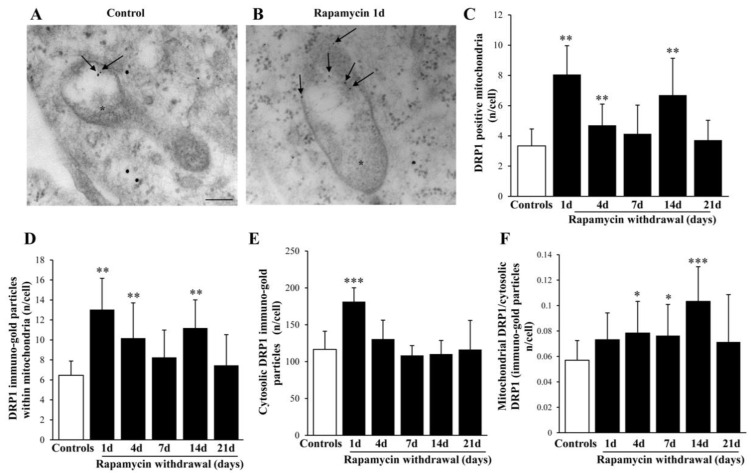
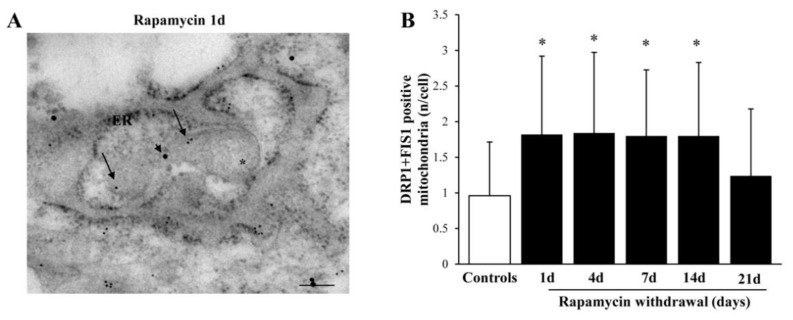
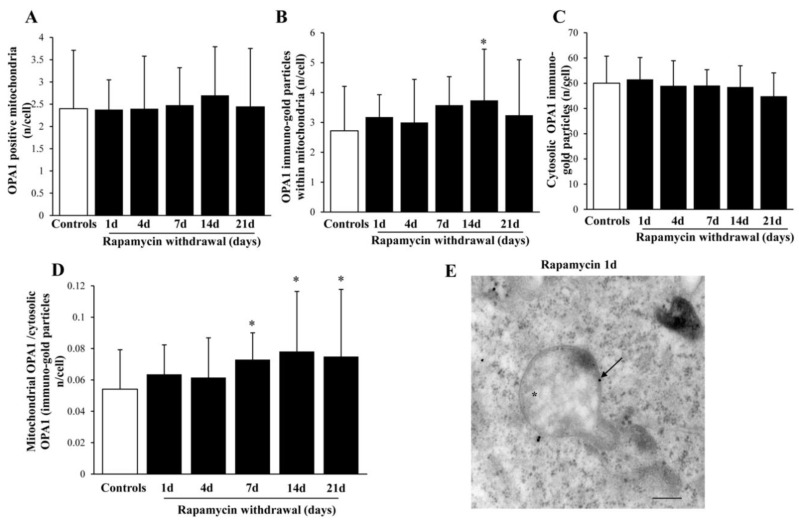
Glioblastoma (GBM) cells feature mitochondrial alterations, which are documented and quantified in the present study, by using ultrastructural morphometry. Mitochondrial impairment, which roughly occurs in half of the organelles, is shown to be related to mTOR overexpression and autophagy suppression. The novelty of the present study consists of detailing an mTOR-dependent mitophagy occlusion, along with suppression of mitochondrial fission. These phenomena contribute to explain the increase in altered mitochondria reported here. Administration of the mTOR inhibitor rapamycin rescues mitochondrial alterations. In detail, rapamycin induces the expression of genes promoting mitophagy (PINK1, PARKIN, ULK1, AMBRA1) and mitochondrial fission (FIS1, DRP1). This occurs along with over-expression of VPS34, an early gene placed upstream in the autophagy pathway. The topographic stoichiometry of proteins coded by these genes within mitochondria indicates that, a remarkable polarization of proteins involved in fission and mitophagy within mitochondria including LC3 takes place. Co-localization of these proteins within mitochondria, persists for weeks following rapamycin, which produces long-lasting mitochondrial plasticity. Thus, rapamycin restores mitochondrial status in GBM cells. These findings add novel evidence about mitochondria and GBM, while fostering a novel therapeutic approach to restore healthy mitochondria through mTOR inhibition.

Keywords: AMBRA1; DRP1; FIS1; OPA1; PARKIN; PINK1; ULK1; VPS34; autophagy; mitochondria.


Conflict of interest statement

The authors declare no conflict of interest.

Figures

Figure 1
Figure 1
Rapamycin increases the number of mitochondria and reduces altered mitochondria time-dependently. (A) Representative pictures of mitochondria from controls and following different time of 10 nM rapamycin withdrawal. Both normally structured, small (arrows), and altered, large mitochondria (arrowhead) are shown in these pictures. Graph (B) reports the total number of mitochondria per cell. Graph (C) reports the percentage of altered mitochondria. Counts represent the mean ± SD from N = 50 cells per group. Asterisk (*) = mitochondria; ER = endoplasmic reticulum. * p ≤ 0.05 compared with control. Scale bars = 1 μm.
Figure 2
Figure 2
During rapamycin withdrawal a persistent increase in the amount of healthy mitochondria takes place. (A) Representative pictures stained with MTR showing healthy mitochondria (arrows) from controls or rapamycin (10 nM for 24 h) at various time intervals following withdrawal (from 1 d up to 21 d). It is evident how rapamycin treatment produces increased fluorescence, which is steady at various time intervals. This is counted in the graph (B), which reports the percentage of MTR histofluorescence compared with control, which persists steadily elevated up to 21 d. Counts represent the mean ± SD from N = 50 cells per group. ∗ p ≤ 0.05 compared with control. Scale Bar = 20 μm.
Figure 3
Figure 3
Effects of rapamycin on fission and fusion genes. RT-PCR for (A) FIS1, (B) DRP1, (C) OPA1. The fission-related genes FIS1 and DRP1 were both increased by rapamycin, with an earlier increase concerning FIS1, which reached back control levels at 7 days. DRP1 increased later reaching back control levels at 14 days. The fusion antigen OPA1 decreased following both a low and high dose of rapamycin and ruse back to control levels at 14 days. Counts represent the mean ± SD. * p ≤ 0.05 compared with control. ** p ≤ 0.05 compared with control and 10 nM rapamycin.
Figure 4
Figure 4
Rapamycin increases the mitophagy genes VPS34 and ULK1 while decreases AMBRA1. RT-PCR for (A) VPS34, (B) ULK1, (C) AMBRA1. In detail, VPS34 and ULK1 were depressed compared with controls a 1 d following rapamycin (both 10 nM and 100 nM) withdrawal. Later on, a marked increase in both genes was measured at 4 d and 7 d, going back to control levels at 14 d. In contrast, AMBRA1 never increased compared with controls. In detail, as occurring for VPS34 and ULK1, AMBRA1 decreases at 1 d following rapamycin (both 10 nM and 100 nM) withdrawal. Such a decrease was evident also during rapamycin administration and at 4 d of withdrawal, when the highest dose (100 nM) of rapamycin was administered. Counts represent the mean ± SD. * p ≤ 0.05 compared with control. ** p ≤ 0.05 compared with control and 10 nM rapamycin.
Figure 5
Figure 5
Rapamycin transiently modifies expression of PINK1 and PARKIN. RT-PCR for (A) PINK1 and (B) PARKIN. PINK1 never increases following rapamycin. This gene undergoes a decrease following 1 d of rapamycin (10 nM and 100 nM withdrawal), with a slight decrease also measured at 7 d following the lowest dose. In contrast, PARKIN rose early on during rapamycin (both doses) administration and similarly to PINK1 decreased transiently at 4 d following both doses of rapamycin. Counts represent the mean ± SD. * p ≤ 0.05 compared with control. ** p ≤ 0.05 compared with control and 10 nM rapamycin.
Figure 6
Figure 6
Rapamycin increases the amount of LC3-positive mitochondria. Representative TEM micrograph showing LC3-positive mitochondria from control (A) and following 1 d rapamycin withdrawal (B). Arrows point to LC3 immuno-gold particles within mitochondria. Graphs report the LC3-positive mitochondria (C), LC3 immuno-gold particles within mitochondria (D), the cytosolic amount of LC3 (E), and the ratio of mitochondrial to cytosolic LC3 particles (F). Counts represent the mean ± SD from N = 50 cells per group. * p ≤ 0.05 compared with control. ** p ≤ 0.05 compared with controls and 21 d. Scale Bar = 0.5 μm, Asterisk (*) = mitochondria, N = nucleus.
Figure 7
Figure 7
Representative immuno-gold and polarization graphs for the mitophagy marker ULK1. Representative TEM micrograph showing ULK1-positive mitochondria from control (A) and following 1 d rapamycin withdrawal (B). Arrows point to ULK1 immuno-gold particles within mitochondria. Graphs report the ULK1-positive mitochondria (C), ULK1 immuno-gold particles within mitochondria (D), the cytosolic amount of ULK1 (E), and the ratio of mitochondrial to cytosolic ULK1 particles (F). Values reported in the graph correspond to the mean ± SD. Mitochondria were counted in 50 cells per group. * p ≤ 0.05 compared with controls. ** p ≤ 0.05 compared with controls and 21 d. *** p ≤ 0.05 compared with controls, 1 d and 21 d. Scale Bar = 0.2 μm, Asterisk (*) = mitochondria, ER = endoplasmic reticulum.
Figure 8
Figure 8
Representative immuno-gold and polarization graphs for the mitophagy marker AMBRA1. Representative TEM micrograph showing AMBRA1-positive mitochondria from control (A) and following 1 d rapamycin withdrawal (B). Arrows point to AMBRA1 immuno-gold particles within mitochondria. Graphs report the AMBRA1-positive mitochondria (C), AMBRA1 immuno-gold particles within mitochondria (D), the cytosolic amount of AMBRA1 (E), and the ratio of mitochondrial to cytosolic AMBRA1 particles (F). Values reported in the graph correspond to the mean ± SD. Mitochondria were counted in 50 cells per group. * p ≤ 0.05 compared with controls. ** p ≤ 0.05 compared with controls and 21 d. Scale Bar = 0.5 μm, Asterisk (*) = mitochondria, ER = endoplasmic reticulum.
Figure 9
Figure 9
Representative immuno-gold and polarization graphs for PARKIN. Representative TEM micrograph showing PARKIN-positive mitochondria from control (A) and following 1 d rapamycin withdrawal (B). Arrows point to PARKIN immuno-gold particles within mitochondria. Graphs report the PARKIN-positive mitochondria (C), PARKIN immuno-gold particles within mitochondria (D), the cytosolic amount of PARKIN (E), and the ratio of mitochondrial to cytosolic PARKIN particles (F). Values reported in the graph correspond to the mean ± SD. Mitochondria were counted in 50 cells per group. * p ≤ 0.05 compared with controls. ** p ≤ 0.05 compared with controls and 21 d. *** p ≤ 0.05 compared with other groups. Scale Bar = 0.5 μm, Asterisk (*) = mitochondria, ER = endoplasmic reticulum.
Figure 10
Figure 10
Representative immuno-gold and polarization graphs for PINK1. Representative TEM micrograph showing PINK1-positive mitochondria from control (A) and following 1 d rapamycin withdrawal (B). Arrows point to PINK1 immuno-gold particles within mitochondria. Graphs report the PINK1-positive mitochondria (C), PINK1 immuno-gold particles within mitochondria (D), the cytosolic amount of PINK1 (E), and the ratio of mitochondrial to cytosolic PINK1 particles (F). Values reported in the graph correspond to the mean ± SD. Mitochondria were counted in 50 cells per group. * p ≤ 0.05 compared with controls. ** p ≤ 0.05 compared with controls and 21 d. Scale Bar = 0.5 μm, Asterisk (*) = mitochondria, ER = endoplasmic reticulum, N = nucleus.
Figure 11
Figure 11
Representative immuno-gold and polarization graphs for the mitochondrial fission marker FIS1. Representative TEM micrograph showing FIS1-positive mitochondria from control (A) and following 1 d rapamycin withdrawal (B). Arrows point to FIS1 immuno-gold particles within mitochondria. Graphs report the FIS1-positive mitochondria (C), FIS1 immuno-gold particles within mitochondria (D), the cytosolic amount of FIS1 (E), and the ratio of mitochondrial to cytosolic FIS1 particles (F). Values reported in the graph correspond to the mean ± SD. Mitochondria were counted in 50 cells per group. * p ≤ 0.05 compared with controls. ** p ≤ 0.05 compared with controls and 21 d. Scale Bar = 0.5 μm, Asterisk (*) = mitochondria, ER = endoplasmic reticulum.
Figure 12
Figure 12
Representative immuno-gold and polarization graphs for the mitochondrial fission marker DRP1. Representative TEM micrograph showing DRP1-positive mitochondria from control (A) and following 1 d rapamycin withdrawal (B). Arrows point to DIRP1 immuno-gold particles within mitochondria. Graphs report the DRP1-positive mitochondria (C), DRP1 immuno-gold particles within mitochondria (D), the cytosolic amount of DRP1 (E), and the ratio of mitochondrial to cytosolic DRP1 particles (F). Values reported in the graph correspond to the mean ± SD. Mitochondria were counted in 50 cells per group. * p ≤ 0.05 compared with controls. ** p ≤ 0.05 compared with controls and 21 d. *** p ≤ 0.05 compared with other groups. Scale Bar = 0.5 μm, Asterisk (*) = mitochondria.
Figure 13
Figure 13
Rapamycin increases the combination of fission markers FIS1 and DRP1. (A) Representative mitochondrion double stained for FIS1 and DRP1 immuno-gold particles (20 nM, arrowhead, and 10 nM, arrows respectively) following 1 d rapamycin withdrawal. Graph (B) reports FIS1+DRP1-positive mitochondria. Values reported in the graph correspond to the mean ± SD. Mitochondria were counted in 50 cells per group. * p ≤ 0.05 compared with controls. Scale Bar = 0.25 μm, Asterisk (*) = mitochondria, ER = endoplasmic reticulum.
Figure 14
Figure 14
Representative immuno-gold and polarization graphs for the mitochondrial fission marker OPA1. Graphs report the OPA1-positive mitochondria (A), OPA1 immuno-gold particles within mitochondria (B), the cytosolic amount of OPA1 (C), and the ratio of mitochondrial to cytosolic OPA1 particles (D). Representative TEM micrograph showing OPA-positive mitochondria from control (E). Arrows point to OPA1 immuno-gold particles within mitochondria. Values reported in the graph correspond to the mean ± SD. Mitochondria were counted in 50 cells per group. * p ≤ 0.05 compared with controls. Scale Bar = 0.3 μm, Asterisk (*) = mitochondria.

Similar articles

Cited by

References

    1. Jiang H., White E.J., Conrad C., Gomez-Manzano C., Fueyo J. Autophagy pathways in glioblastoma. Methods Enzymol. 2009;453:273–286. - PubMed
    1. Zhao Y., Huang Q., Yang J., Lou M., Wang A., Dong J., Qin Z., Zhang T. Autophagy impairment inhibits differentiation of glioma stem/progenitor cells. Brain Res. 2010;1313:250–258. doi: 10.1016/j.brainres.2009.12.004. - DOI - PubMed
    1. Klionsky D.J., Abdel-Aziz A.K., Abdelfatah S., Abdellatif M., Abdoli A., Abel S., Abeliovich H., Abildgaard M.H., Abudu Y.P., Acevedo-Arozena A., et al. Guidelines for the use and interpretation of assays for monitoring autophagy (4th edition) Autophagy. 2021;17:1–382. - PMC - PubMed
    1. Zhuang W., Li B., Long L., Chen L., Huang Q., Liang Z. Induction of autophagy promotes differentiation of glioma-initiating cells and their radiosensitivity. Int. J. Cancer. 2011;129:2720–2731. doi: 10.1002/ijc.25975. - DOI - PubMed
    1. Arcella A., Biagioni F., Oliva M.A., Bucci D., Frati A., Esposito V., Cantore G., Giangaspero F., Fornai F. Rapamycin inhibits the growth of glioblastoma. Brain Res. 2013;1495:37–51. doi: 10.1016/j.brainres.2012.11.044. - DOI - PubMed

LinkOut - more resources