. 2021 May 20;13(5):942.
doi: 10.3390/v13050942.

SARS-CoV-2 Disinfection of Air and Surface Contamination by TiO2 Photocatalyst-Mediated Damage to Viral Morphology, RNA, and Protein

Affiliations

SARS-CoV-2 Disinfection of Air and Surface Contamination by TiO2 Photocatalyst-Mediated Damage to Viral Morphology, RNA, and Protein

Ryosuke Matsuura et al. Viruses. .

Abstract

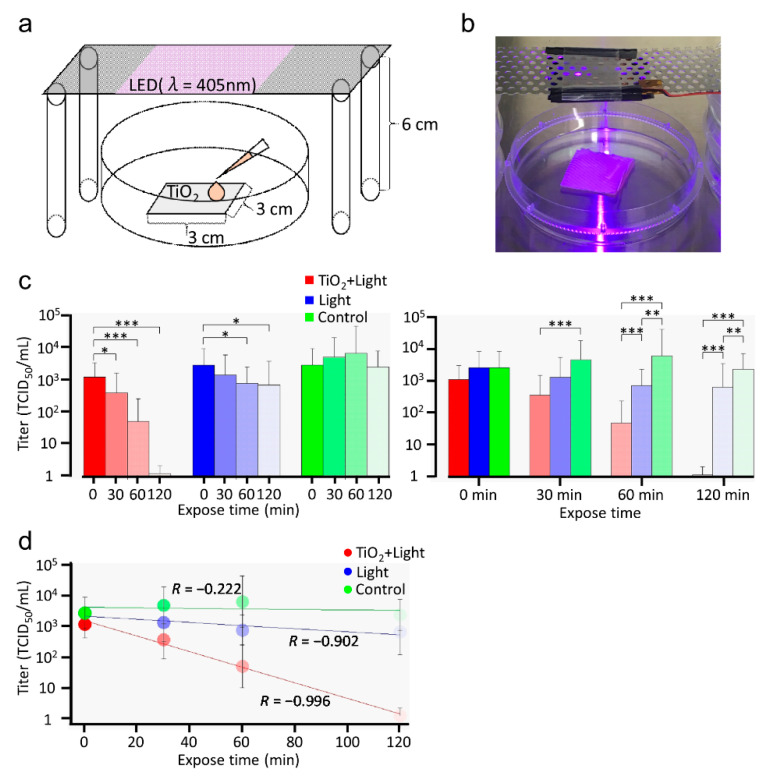
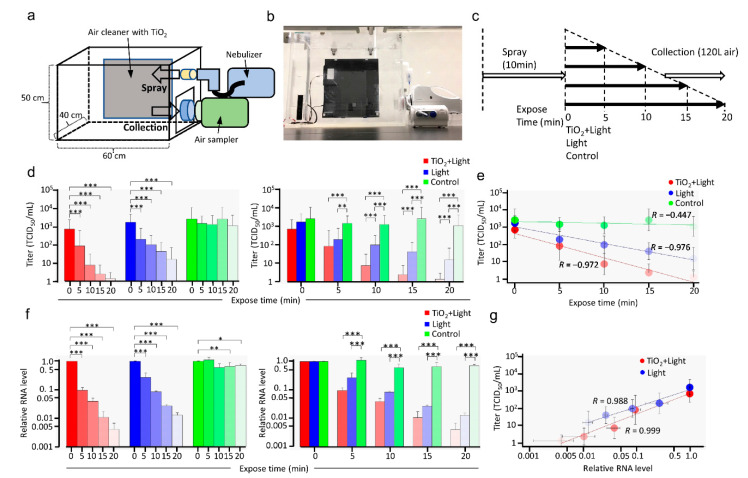
SARS-CoV-2 is the causative agent of COVID-19, which is a global pandemic. SARS-CoV-2 is transmitted rapidly via contaminated surfaces and aerosols, emphasizing the importance of environmental disinfection to block the spread of virus. Ultraviolet C radiation and chemical compounds are effective for SARS-CoV-2 disinfection, but can only be applied in the absence of humans due to their toxicities. Therefore, development of disinfectants that can be applied in working spaces without evacuating people is needed. Here we showed that TiO2-mediated photocatalytic reaction inactivates SARS-CoV-2 in a time-dependent manner and decreases its infectivity by 99.9% after 20 min and 120 min of treatment in aerosol and liquid, respectively. The mechanistic effects of TiO2 photocatalyst on SARS-CoV-2 virion included decreased total observed virion count, increased virion size, and reduced particle surface spike structure, as determined by transmission electron microscopy. Damage to viral proteins and genome was further confirmed by western blotting and RT-qPCR, respectively. The multi-antiviral effects of TiO2-mediated photocatalytic reaction implies universal disinfection potential for different infectious agents. Notably, TiO2 has no adverse effects on human health, and therefore, TiO2-induced photocatalytic reaction is suitable for disinfection of SARS-CoV-2 and other emerging infectious disease-causing agents in human habitation.

Keywords: RNA damage; SARS-CoV-2 inactivation; TiO2 photocatalyst; aerosol; viral morphology disruption; viral protein damage.


Conflict of interest statement

The authors declare no conflict of interest.

Figures

Figure 1
Figure 1
Inactivation of SARS-CoV-2 in liquid by LED-TiO2 photocatalytic reaction. Schematic diagram (a) and images (b) of TiO2-coated sheet (3 cm × 3 cm) placed a 10-cm dish and exposed to light emitting diode (LED) light with a wavelength of 405 nm placed 6 cm above the dish. In the TiO2 + Light group, SARS-CoV-2 (1 mL) titer (1.0 × 10⁵ TCID50/mL) was placed on the TiO2-coated sheet. In the Light and control groups, SARS-CoV-2 was directly placed on 10-cm dishes. In the TiO2 + Light and Light groups, SARS-CoV-2 were exposed to LED light for 0, 30, 60, or 120 min. Then, SARS-CoV-2 were collected by adding 9 mL PBS. (c) After the photocatalytic reaction, viral titer was confirmed by TCID50 assay. Each column and error bar represents the mean ± SD of the results for two independent experiments. All values in each group were compared with those of the 0 min sample by two-way ANOVA with Dunnett’s test (left panel). All values at each time point were analyzed by two-way ANOVA followed by Tukey’s test (right panel). Asterisk indicates a statistically significant difference (* p < 0.05; ** p < 0.01; *** p < 0.001). (d) Linear regression analysis was used to examine the correlation between LED-TiO2 photocatalytic reaction duration and SARS-CoV-2 infectivity. R indicates the Pearson correlation coefficient.
Figure 2
Figure 2
Changes in SARS-CoV-2 virion morphology due to LED-TiO2 photocatalytic reaction. (a) SARS-CoV-2 (1 mL) titer of 1.78 × 10⁶ TCID50/mL was placed on TiO2-coated sheet and subjected to photocatalytic reaction for 120 min before TEM imaging. Representative virion images in the TiO2 + Light, Light, and control groups are shown. Bar = 100 nm. (b) Number of S proteins on single virions in individual TEM images of the TiO2 + Light, Light, and control groups was counted, and distribution and mean number of S protein/virion are shown. n = 50/group. (c) Each dot represents a value of S protein of each virion in (b). (d) Virion number in an area of 170 μm2 in an individual TEM image is shown, n = 10. (e) Diameter of single virion in an individual TEM image is shown. n = 40. (f) Viral titer in each group was confirmed by TCID50 assay. Each column and error bar represents the mean ± SD of results. All values were analyzed by two-way ANOVA followed by Tukey’s test. Asterisk indicates a statistically significant difference (* p < 0.05; ** p < 0.01; *** p < 0.001).
Figure 3
Figure 3
Damage to SARS-CoV-2 viral proteins by LED-TiO2 photocatalytic reaction. (ac) SARS-CoV-2 (1 mL) titer of 1.78 × 10⁶ TCID50/mL was placed on TiO2-coated sheet and subjected to photocatalytic reaction for 0, 30, 60, and 120 min before western blotting for S (a, upper panel) and N proteins (b, upper panel) of SARS-CoV-2. Original blots can be seen in Figure S1. Positions of S and N proteins are indicated. Intensities of bands were analyzed using CSAnlyzer4 software and the quantitative results are shown (a,b, lower panels). Data in the plot represent the mean ± standard error (SD) of three or four replicates. Each viral titer sample was examined by TCID50 assay (c). (d,e) Linear regression analysis between relative SARS-CoV-2 infectivity and band intensity of S (d) and N (e) proteins. Each column and error bar represent the mean ± SD of results for two experiments. R indicates the Pearson correlation coefficient. All values were analyzed by two-way ANOVA with Dunnett’s test. Asterisk indicates a statistically significant difference (** p < 0.01; *** p < 0.001).
Figure 4
Figure 4
Damage to SARS-CoV-2 RNA by LED-TiO2 photocatalytic reaction. (a) Schematic diagram of RT-qPCR primer-binding sites. (b) SARS-CoV-2 (1 mL) titer of 1.0 × 10⁵ TCID50/mL was placed on the TiO2-coated sheet and subjected to photocatalytic reaction for 0, 30, 60, and 120 min, and then viral RNA was extracted and measured by RT-qPCR. The relative RNA level compared to that in samples obtained at 0 min after LED light irradiation was calculated. All values in each group were compared with the 0 min sample by two-way ANOVA with Dunnett’s test (left panel). All values at each time point were analyzed by two-way ANOVA followed by Tukey’s test (right panel). (c) Linear regression analysis between SARS-CoV-2 infectivity (Figure 1) and RNA level. Each column and error bar represent the mean ± SD of results for two experiments. Asterisk indicates a statistically significant difference (** p < 0.01; *** p < 0.001). R indicates the Pearson correlation coefficient.
Figure 5
Figure 5
Inactivation of SARS-CoV-2 in aerosols by LED-TiO2 photocatalytic reaction. Schematic diagram (a), image (b), and time course (c) of the inactivation of SARS-CoV-2 in the aerosol test system. SARS-CoV-2 (2.3 mL) titer of 1.78 × 10⁶ TCID50/mL was sprayed as aerosol into a 120 L acrylic box using nebulizer for 10 min. Then, air cleaner with TiO2-coated sheet and LED light or only LED light was used to circulate SARS-CoV-2 in aerosols. As control, SARS-CoV-2 in aerosol were left without circulation using air cleaner. SARS-CoV-2 in aerosols were captured in gelatin filter using MS8 microbiological sampler with 120 L and the gelatin membrane filter was molten in MEM containing 2% FBS. (d) Viral titer of SARS-CoV-2 collected from the gelatin membrane filter was assessed by TCID50 assay. All values in each group were compared with those of the sample obtained at 0 min by two-way ANOVA with Dunnett’s test (left panel). All values at each time point were analyzed by two-way ANOVA followed by Tukey’s test (right panel). Asterisk indicates a statistically significant difference (* p < 0.05; ** p < 0.01; *** p < 0.001). (e) Linear regression analysis to examine the correlation between LED-TiO2 photocatalytic reaction duration and SARS-CoV-2 infectivity. R indicates the Pearson correlation coefficient. (f) Viral RNA was extracted from the gelatin membrane filter and detected by RT-qPCR. All values in each group were compared with those of the 0 min sample by two-way ANOVA with Dunnett’s test (left panel). All values at each time point were analyzed by two-way ANOVA followed by Tukey’s test (right panel). Asterisk indicates a statistically significant difference (* p < 0.05; ** p < 0.01; *** p < 0.001). (g) Linear regression analysis to examine the correlation between SARS-CoV-2 infectivity and relative viral RNA level. Each column and error bar represent the mean ± SD of results for two experiments. R indicates the Pearson correlation coefficient.

References

    1. Wu F., Zhao S., Yu B., Chen Y.M., Wang W., Song Z.G., Hu Y., Tao Z.W., Tian J.H., Pei Y.Y., et al. A new coronavirus associated with human respiratory disease in China. Nature. 2020;579:265–269. doi: 10.1038/s41586-020-2008-3. - DOI - PMC - PubMed
    1. Naqvi A.A.T., Fatima K., Mohammad T., Fatima U., Singh I.K., Singh A., Atif S.M., Hariprasad G., Hasan G.M., Hassan M.I. Insights into SARS-CoV-2 genome, structure, evolution, pathogenesis and therapies: Structural genomics approach. Biochim. Biophys. Acta Mol. Basis. Dis. 2020;1866:165878. doi: 10.1016/j.bbadis.2020.165878. - DOI - PMC - PubMed
    1. Schoeman D., Fielding B.C. Coronavirus envelope protein: Current knowledge. Virol. J. 2019;16:69. doi: 10.1186/s12985-019-1182-0. - DOI - PMC - PubMed
    1. Pal M., Berhanu G., Desalegn C., Kandi V. Severe Acute Respiratory Syndrome Coronavirus-2 (SARS-CoV-2): An Update. Cureus. 2020;12:e7423. doi: 10.7759/cureus.7423. - DOI - PMC - PubMed
    1. van Doremalen N., Bushmaker T., Morris D.H., Holbrook M.G., Gamble A., Williamson B.N., Tamin A., Harcourt J.L., Thornburg N.J., Gerber S.I., et al. Aerosol and Surface Stability of SARS-CoV-2 as Compared with SARS-CoV-1. N. Engl. J. Med. 2020;382:1564–1567. doi: 10.1056/NEJMc2004973. - DOI - PMC - PubMed

Publication types