

KRAS and EGFR Mutations Differentially Alter ABC Drug Transporter Expression in Cisplatin-Resistant Non-Small Cell Lung Cancer
- PMID: 34065402
- PMCID: PMC8160643
- DOI: 10.3390/ijms22105384
KRAS and EGFR Mutations Differentially Alter ABC Drug Transporter Expression in Cisplatin-Resistant Non-Small Cell Lung Cancer
Abstract
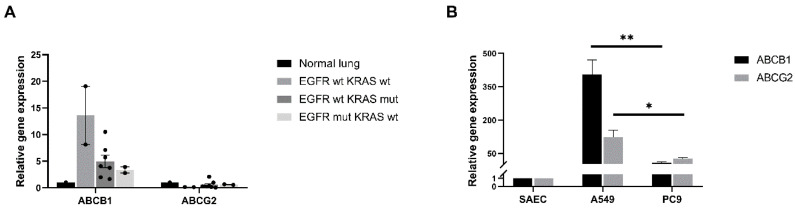
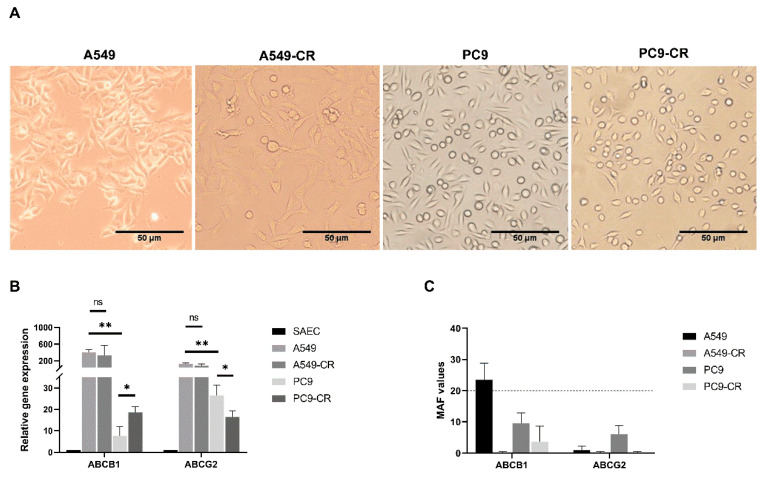
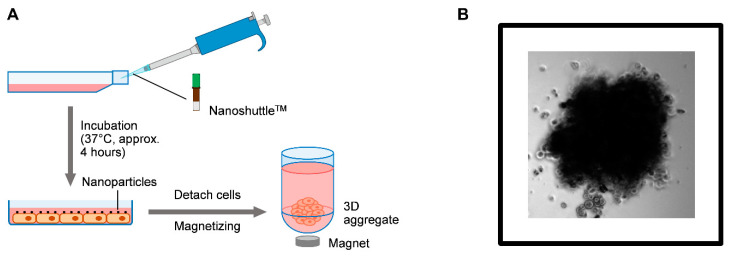
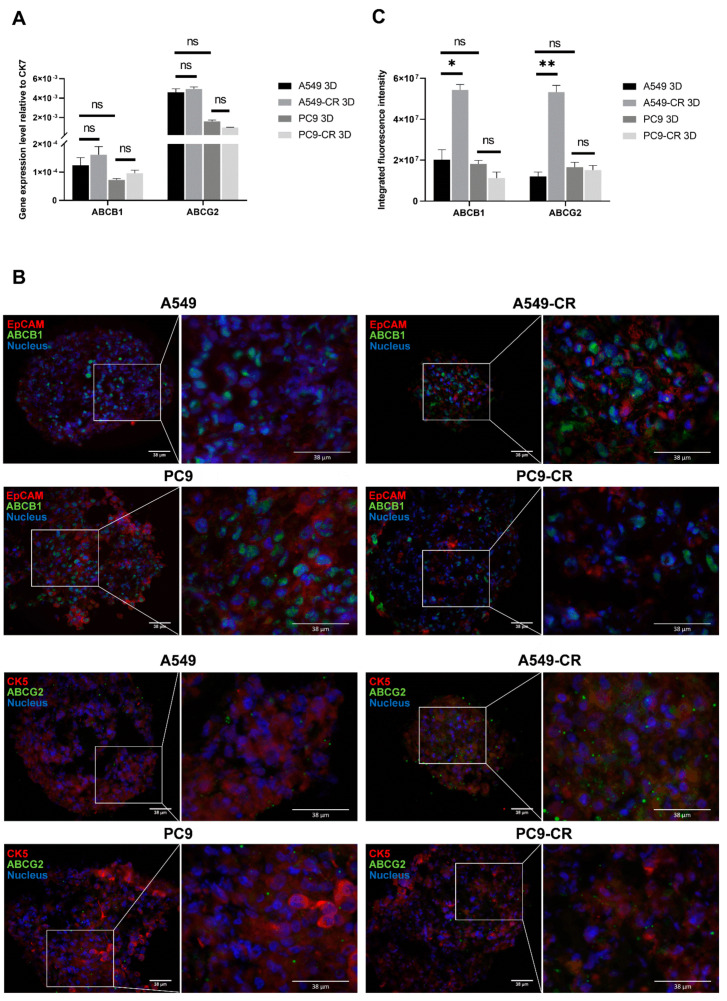
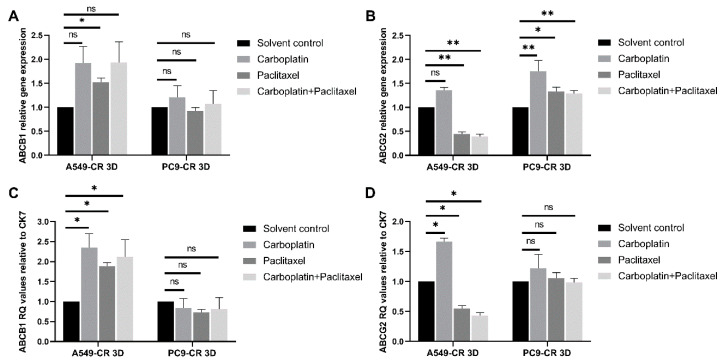
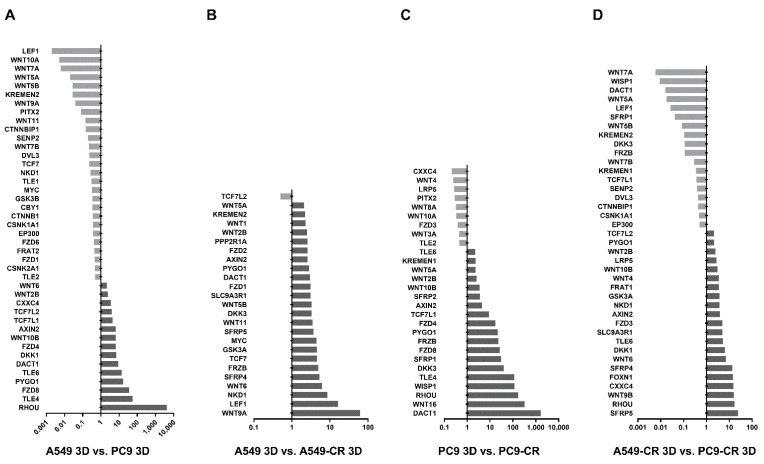
Lung carcinoma is still the most common malignancy worldwide. One of the major subtypes of non-small cell lung cancer (NSCLC) is adenocarcinoma (AC). As driver mutations and hence therapies differ in AC subtypes, we theorized that the expression and function of ABC drug transporters important in multidrug resistance (MDR) would correlate with characteristic driver mutations KRAS or EGFR. Cisplatin resistance (CR) was generated in A549 (KRAS) and PC9 (EGFR) cell lines and gene expression was tested. In three-dimensional (3D) multicellular aggregate cultures, both ABCB1 and ABCG2 transporters, as well as the WNT microenvironment, were investigated. ABCB1 and ABCG2 gene expression levels were different in primary AC samples and correlated with specific driver mutations. The drug transporter expression pattern of parental A549 and PC9, as well as A549-CR and PC9-CR, cell lines differed. Increased mRNA levels of ABCB1 and ABCG2 were detected in A549-CR cells, compared to parental A549, while the trend observed in the case of PC9 cells was different. Dominant alterations were observed in LEF1, RHOU and DACT1 genes of the WNT signalling pathway in a mutation-dependent manner. The study confirmed that, in lung AC-s, KRAS and EGFR driver mutations differentially affect both drug transporter expression and the cisplatin-induced WNT signalling microenvironment.
Keywords: ABC drug transporters; AC; EGFR; KRAS; NSCLC; WNT signalling.
Conflict of interest statement
The authors declare no conflict of interest.
Figures
Similar articles
-
ABCB1 and ABCG2 drug transporters are differentially expressed in non-small cell lung cancers (NSCLC) and expression is modified by cisplatin treatment via altered Wnt signaling.Respir Res. 2017 Mar 24;18(1):52. doi: 10.1186/s12931-017-0537-6. Respir Res. 2017. PMID: 28340578 Free PMC article.
-
miR-202 Enhances the Anti-Tumor Effect of Cisplatin on Non-Small Cell Lung Cancer by Targeting the Ras/MAPK Pathway.Cell Physiol Biochem. 2018;51(5):2160-2171. doi: 10.1159/000495835. Epub 2018 Dec 6. Cell Physiol Biochem. 2018. PMID: 30522099
-
Influence of EGFR-activating mutations on sensitivity to tyrosine kinase inhibitors in a KRAS mutant non-small cell lung cancer cell line.PLoS One. 2020 Mar 4;15(3):e0229712. doi: 10.1371/journal.pone.0229712. eCollection 2020. PLoS One. 2020. PMID: 32130260 Free PMC article.
-
Shaping the battlefield: EGFR and KRAS tumor mutations' role on the immune microenvironment and immunotherapy responses in lung cancer.Cancer Metastasis Rev. 2025 Jun 17;44(3):56. doi: 10.1007/s10555-025-10272-4. Cancer Metastasis Rev. 2025. PMID: 40524071 Free PMC article. Review.
-
Regulation of EGFR signalling by palmitoylation and its role in tumorigenesis.Open Biol. 2021 Oct;11(10):210033. doi: 10.1098/rsob.210033. Epub 2021 Oct 6. Open Biol. 2021. PMID: 34610265 Free PMC article. Review.
Cited by
-
A hypoxia-derived gene signature to suggest cisplatin-based therapeutic responses in patients with cervical cancer.Comput Struct Biotechnol J. 2024 Jun 8;23:2565-2579. doi: 10.1016/j.csbj.2024.06.007. eCollection 2024 Dec. Comput Struct Biotechnol J. 2024. PMID: 38983650 Free PMC article.
-
ABCG2 Gene Expression in Non-Small Cell Lung Cancer.Biomedicines. 2024 Oct 19;12(10):2394. doi: 10.3390/biomedicines12102394. Biomedicines. 2024. PMID: 39457707 Free PMC article.
-
Progress in the studies on the molecular mechanisms associated with multidrug resistance in cancers.Acta Pharm Sin B. 2023 Mar;13(3):982-997. doi: 10.1016/j.apsb.2022.10.002. Epub 2022 Oct 7. Acta Pharm Sin B. 2023. PMID: 36970215 Free PMC article. Review.
-
Steroidal saponins: Natural compounds with the potential to reverse tumor drug resistance (Review).Oncol Lett. 2024 Oct 3;28(6):585. doi: 10.3892/ol.2024.14719. eCollection 2024 Dec. Oncol Lett. 2024. PMID: 39421314 Free PMC article. Review.
-
Clinical Application Perspectives of Lung Cancers 3D Tumor Microenvironment Models for In Vitro Cultures.Int J Mol Sci. 2022 Feb 18;23(4):2261. doi: 10.3390/ijms23042261. Int J Mol Sci. 2022. PMID: 35216378 Free PMC article. Review.
References
-
- Sung H., Ferlay J., Siegel R.L., Laversanne M., Soerjomataram I., Jemal A., Bray F. Global Cancer Statistics 2020: GLOBOCAN Estimates of Incidence and Mortality Worldwide for 36 Cancers in 185 Countries. [(accessed on 20 April 2021)];CA Cancer J. Clin. 2021 71:209–249. doi: 10.3322/caac.21660. As part of International Association of Cancer Registries, (IACR). 2020, Global Cancer Observatory. Available online: http://gco.iarc.fr/ - DOI - PubMed
-
- Ritter J.H. Tumors of the Lower Respiratory Tract: Atlas of Tumor Pathology. Am. J. Clin. Pathol. 2018;105:129–130. doi: 10.1093/ajcp/105.1.129a. - DOI
MeSH terms
Substances
Grants and funding
LinkOut - more resources
Full Text Sources
Medical
Research Materials
Miscellaneous
