

A Novel Three-Gene Score as a Predictive Biomarker for Pathologically Complete Response after Neoadjuvant Chemotherapy in Triple-Negative Breast Cancer
- PMID: 34065619
- PMCID: PMC8156144
- DOI: 10.3390/cancers13102401
A Novel Three-Gene Score as a Predictive Biomarker for Pathologically Complete Response after Neoadjuvant Chemotherapy in Triple-Negative Breast Cancer
Abstract
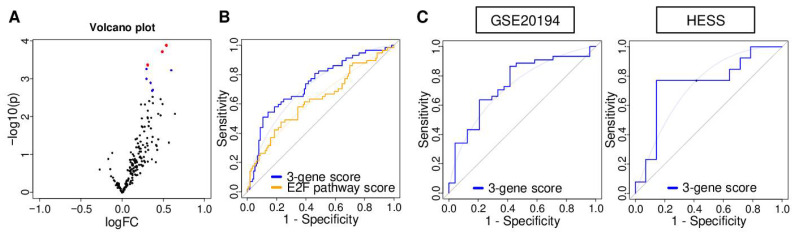
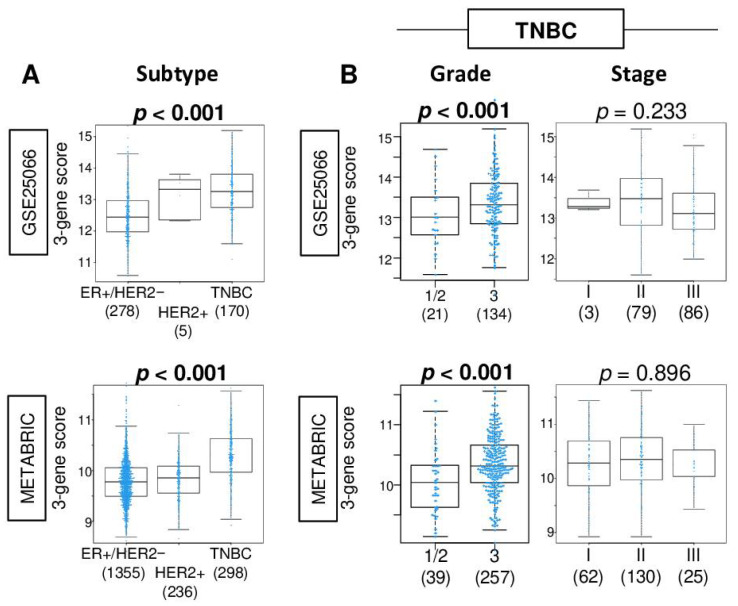
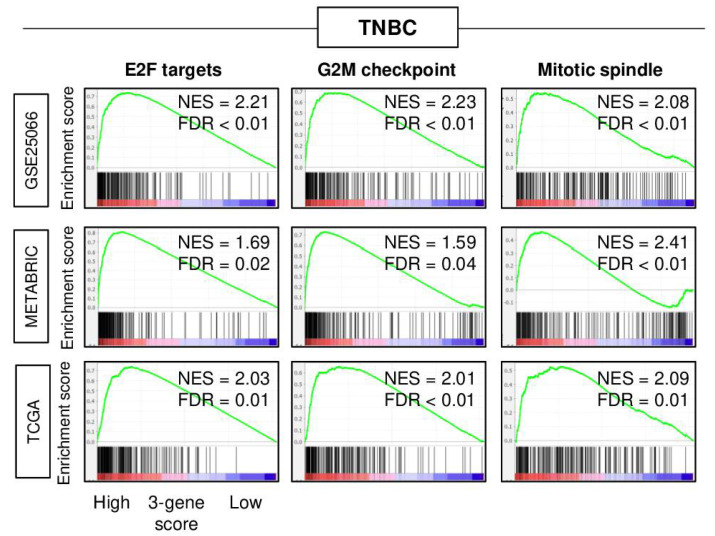
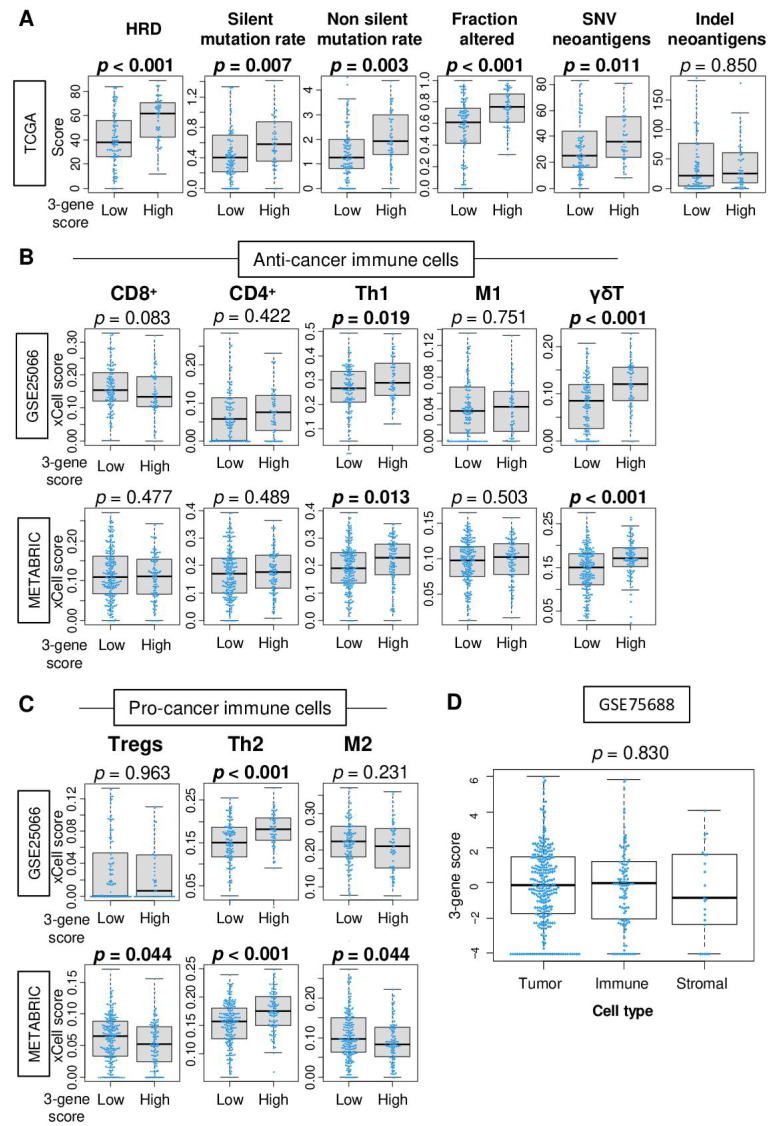
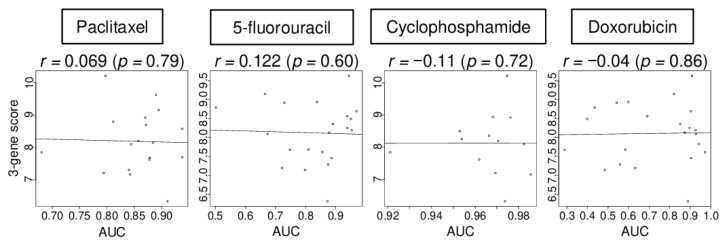
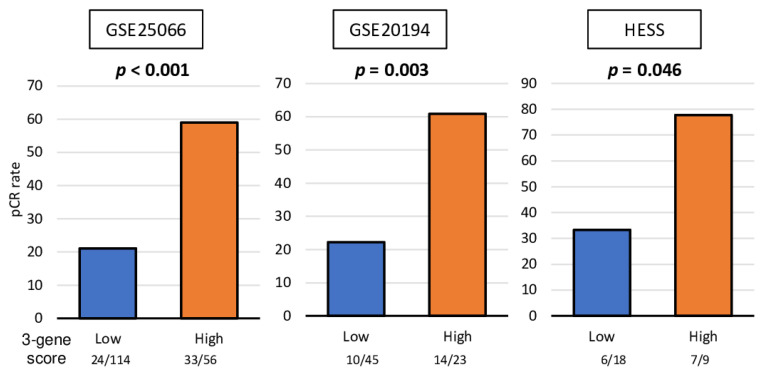
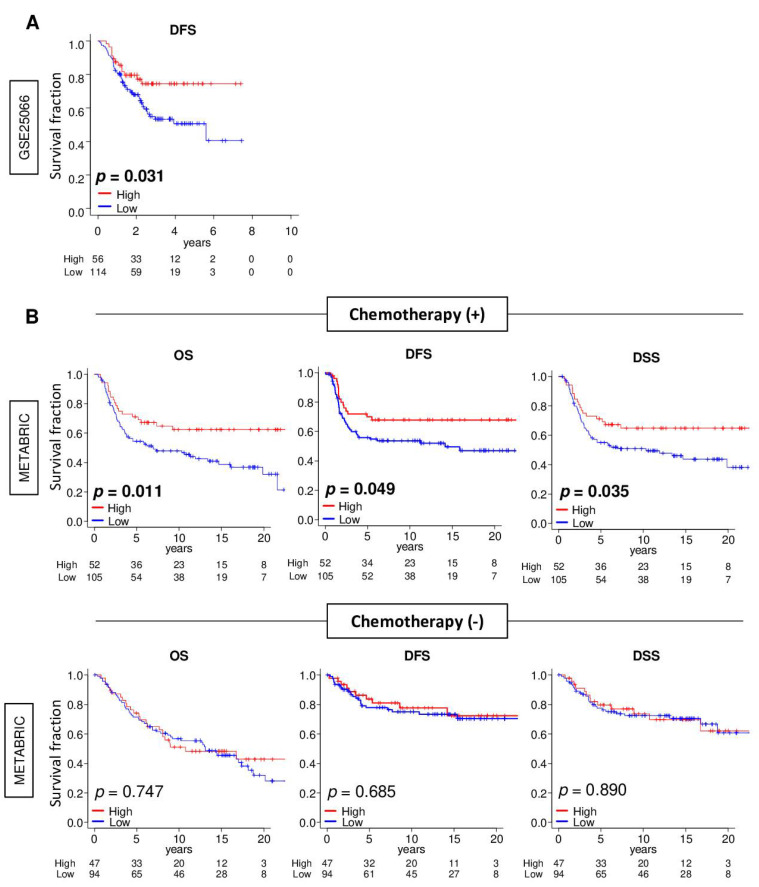
Although triple-negative breast cancer (TNBC) typically responds better to neoadjuvant chemotherapy (NAC) compared to the other subtypes, a pathological complete response (pCR) is achieved in less than half of the cases. We established a novel three-gene score using genes based on the E2F target gene set that identified pCR after NAC, which showed robust performance in both training and validation cohorts (total of n = 3862 breast cancer patients). We found that the three-gene score was elevated in TNBC compared to the other subtypes. A high score was associated with Nottingham histological grade 3 in TNBC. Across multiple cohorts, high-score TNBC enriched not only E2F targets but also G2M checkpoint and mitotic spindle, which are all cell proliferation-related gene sets. High-score TNBC was associated with homologous recombination deficiency, high mutation load, and high infiltration of Th1, Th2, and gamma-delta T cells. However, the score did not correlate with drug sensitivity for paclitaxel, 5-fluorouracil, cyclophosphamide, and doxorubicin in TNBC human cell lines. High-score TNBC was significantly associated with a high rate of pCR not only in the training cohort but also in the validation cohorts. High-score TNBC was significantly associated with better survival in patients who received chemotherapy but not in patients who did not receive chemotherapy. The three-gene score is associated with a high mutation rate, immune cell infiltration, and predicts response to NAC in TNBC.
Keywords: neoadjuvant chemotherapy; predictive biomarker; prognosis; three gene; triple-negative breast cancer; tumor immune microenvironment.
Conflict of interest statement
The authors declare no conflict of interest.
Figures
Similar articles
-
A novel five-gene score to predict complete pathological response to neoadjuvant chemotherapy in ER-positive/HER2-negative breast cancer.Am J Cancer Res. 2021 Jul 15;11(7):3611-3627. eCollection 2021. Am J Cancer Res. 2021. PMID: 34354863 Free PMC article.
-
Activity-Regulated Cytoskeleton-Associated Protein Gene Expression Is Associated With High Infiltration of Stromal Cells and Immune Cells, but With Less Cancer Cell Proliferation and Better Overall Survival in Estrogen Receptor-Positive/Human Epidermal Growth Factor Receptor 2-Negative Breast Cancers.World J Oncol. 2025 Feb;16(1):16-29. doi: 10.14740/wjon1936. Epub 2025 Jan 13. World J Oncol. 2025. PMID: 39850523 Free PMC article.
-
Immune microenvironment, homologous recombination deficiency, and therapeutic response to neoadjuvant chemotherapy in triple-negative breast cancer: Japan Breast Cancer Research Group (JBCRG)22 TR.BMC Med. 2022 Apr 25;20(1):136. doi: 10.1186/s12916-022-02332-1. BMC Med. 2022. PMID: 35462552 Free PMC article.
-
Current strategy for triple-negative breast cancer: appropriate combination of surgery, radiation, and chemotherapy.Breast Cancer. 2011 Jul;18(3):165-73. doi: 10.1007/s12282-011-0254-9. Epub 2011 Feb 3. Breast Cancer. 2011. PMID: 21290263 Review.
-
Immunotherapy in Early-Stage Triple-Negative Breast Cancer: Where Are We Now and Where Are We Headed?Curr Treat Options Oncol. 2023 Aug;24(8):1004-1020. doi: 10.1007/s11864-023-01087-y. Epub 2023 May 24. Curr Treat Options Oncol. 2023. PMID: 37222922 Free PMC article. Review.
Cited by
-
Development of Gene Expression-Based Random Forest Model for Predicting Neoadjuvant Chemotherapy Response in Triple-Negative Breast Cancer.Cancers (Basel). 2022 Feb 10;14(4):881. doi: 10.3390/cancers14040881. Cancers (Basel). 2022. PMID: 35205629 Free PMC article.
-
The American Joint Committee on Cancer (AJCC) Breast Cancer Staging, Eighth Edition, is more Reflective of Cancer Biology than the Seventh Edition.Ann Surg Oncol. 2025 May;32(5):3268-3277. doi: 10.1245/s10434-025-16889-7. Epub 2025 Feb 7. Ann Surg Oncol. 2025. PMID: 39918749
-
High miR-99b expression is associated with cell proliferation and worse patient outcomes in breast cancer.Am J Cancer Res. 2022 Oct 15;12(10):4840-4852. eCollection 2022. Am J Cancer Res. 2022. PMID: 36381329 Free PMC article.
-
Biomarker potential of the LEF1/TCF family members in breast cancer: Bioinformatic investigation on expression and clinical significance.Genet Mol Biol. 2023 Dec 15;46(4):e20220346. doi: 10.1590/1678-4685-GMB-2022-0346. eCollection 2023. Genet Mol Biol. 2023. PMID: 38100720 Free PMC article.
-
Construction of a risk stratification model integrating ctDNA to predict response and survival in neoadjuvant-treated breast cancer.BMC Med. 2023 Dec 12;21(1):493. doi: 10.1186/s12916-023-03163-4. BMC Med. 2023. PMID: 38087296 Free PMC article.
References
-
- Esserman L.J., Berry D.A., DeMichele A., Carey L., Davis S.E., Buxton M., Hudis C., Gray J.W., Perou C., Yau C., et al. Pathologic complete response predicts recurrence-free survival more effectively by cancer subset: Results from the I-SPY 1 TRIAL--CALGB 150007/150012, ACRIN 6657. J. Clin. Oncol. 2012;30:3242–3249. doi: 10.1200/JCO.2011.39.2779. - DOI - PMC - PubMed
Grants and funding
LinkOut - more resources
Full Text Sources
