. 2021 May 16;13(10):2402.
doi: 10.3390/cancers13102402.

Disruption of YY1-EZH2 Interaction Using Synthetic Peptides Inhibits Breast Cancer Development

Affiliations

Disruption of YY1-EZH2 Interaction Using Synthetic Peptides Inhibits Breast Cancer Development

Cheng Yi et al. Cancers (Basel). .

Abstract

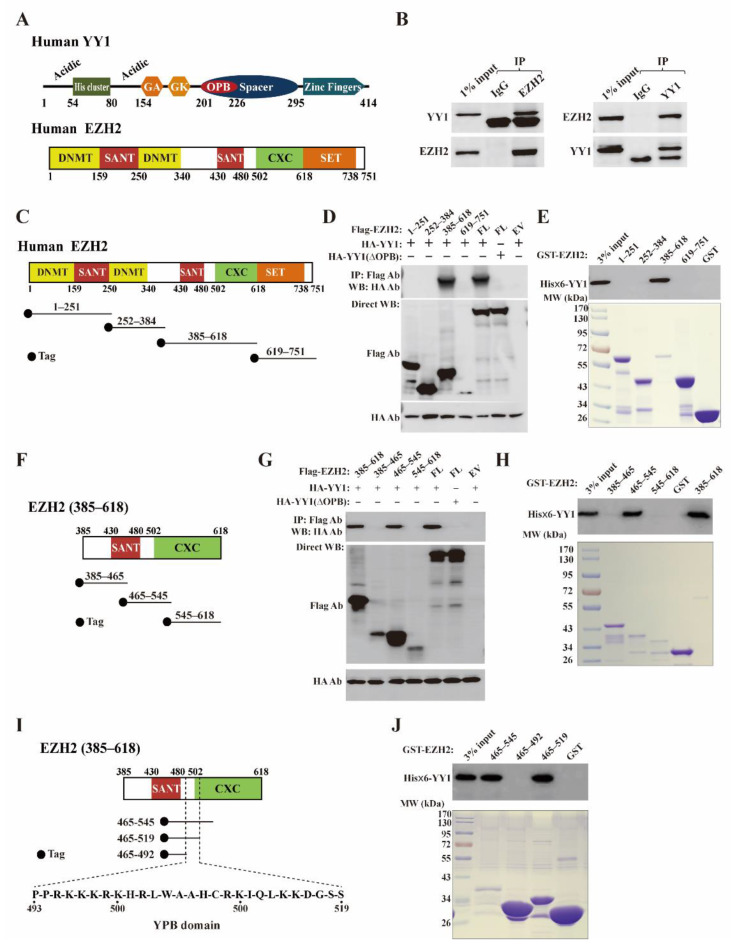
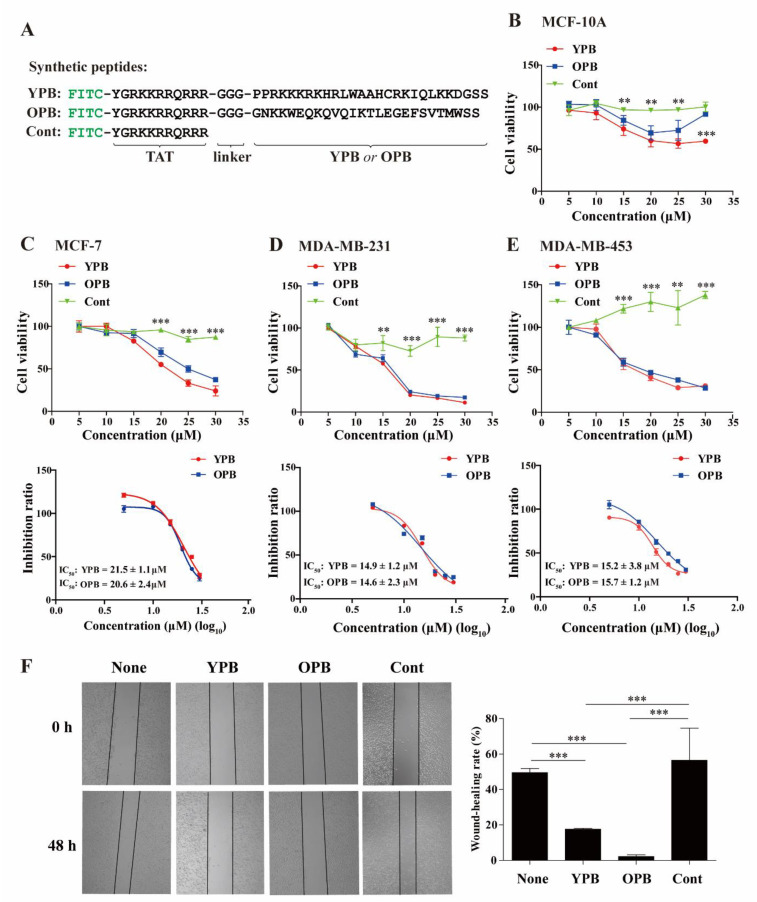
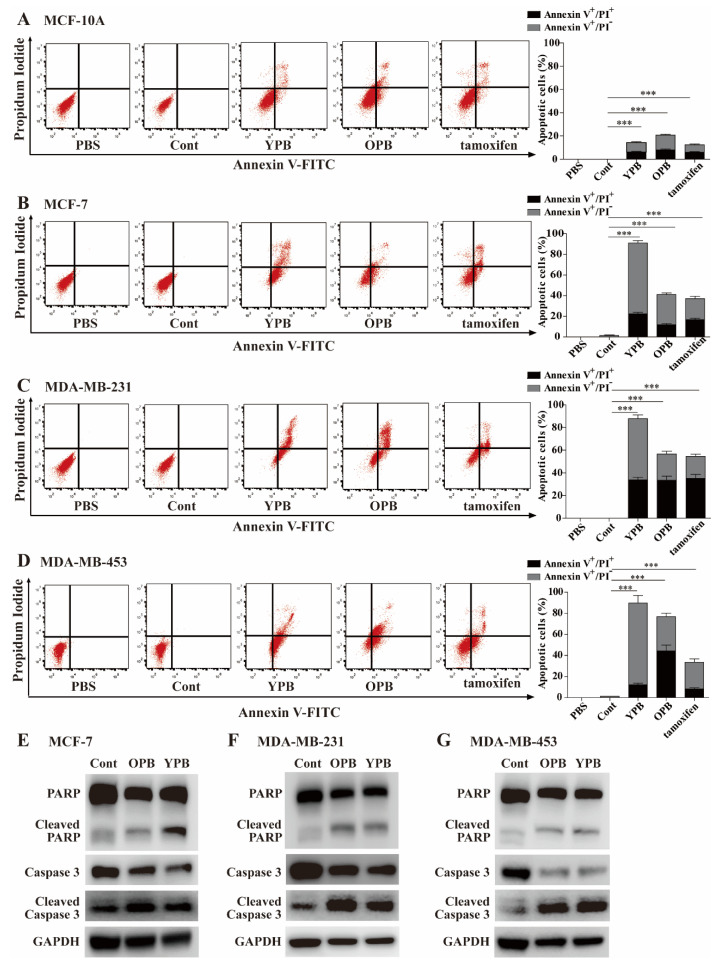
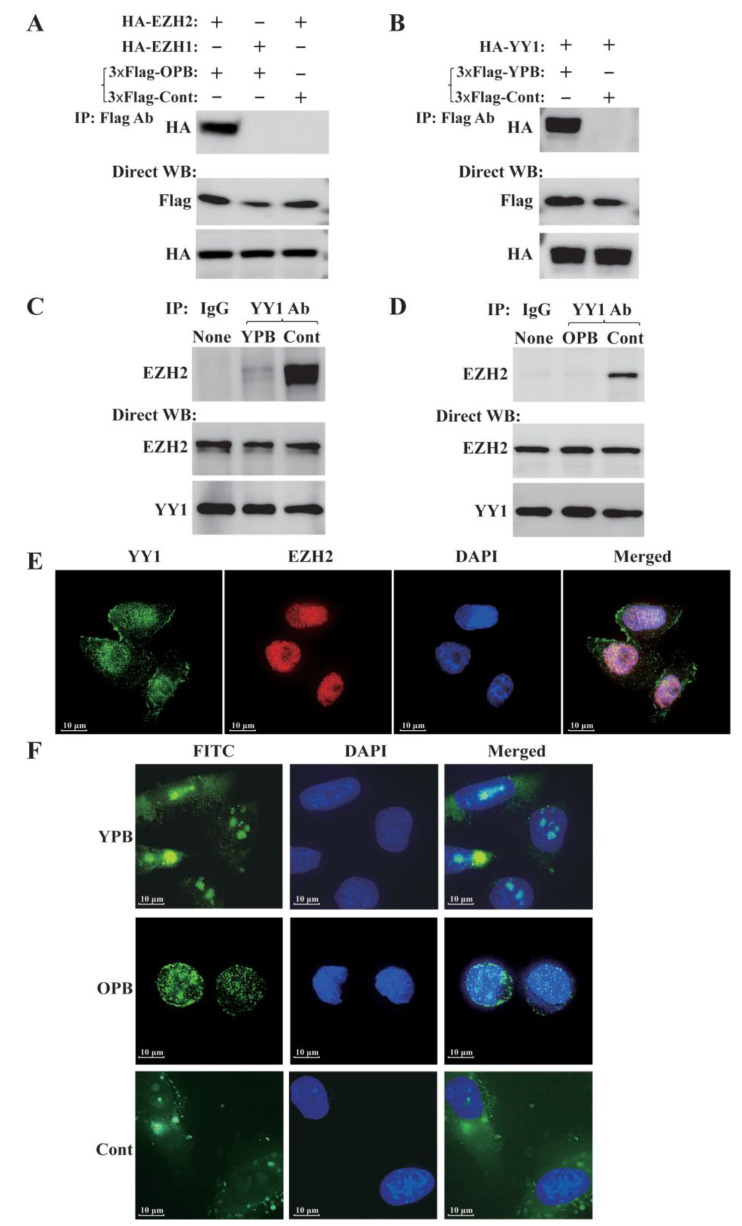
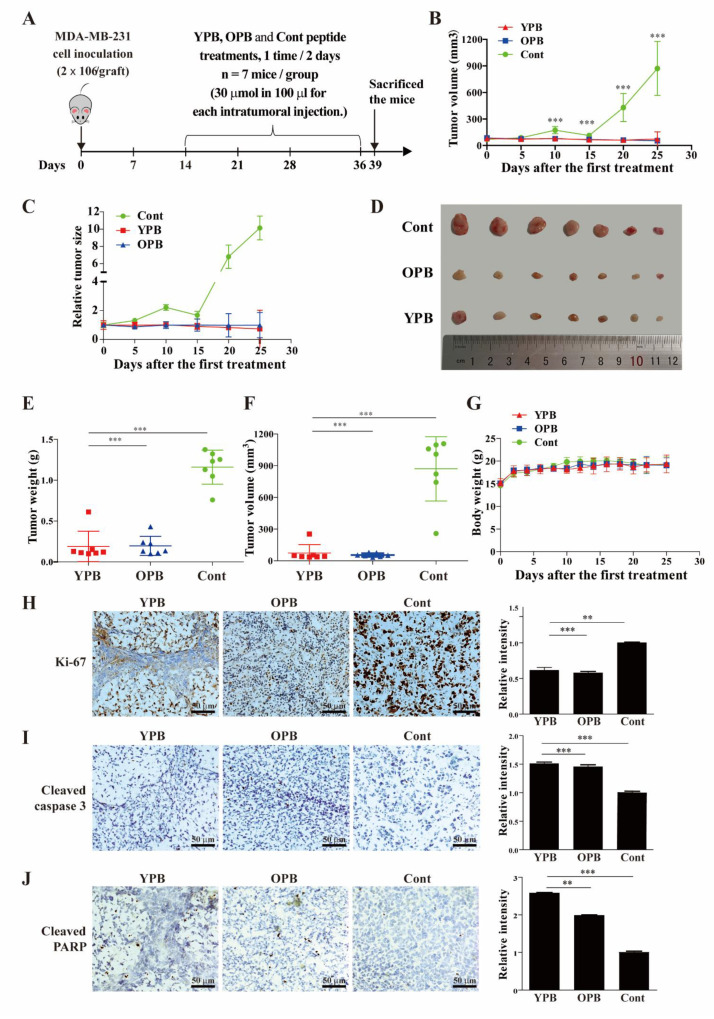
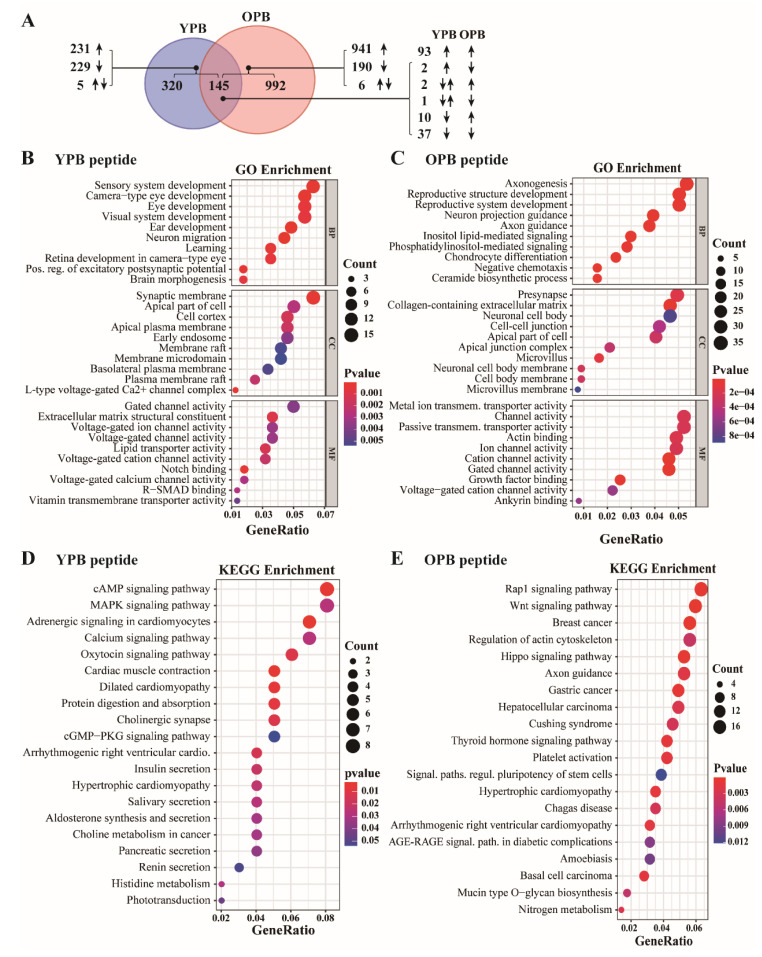
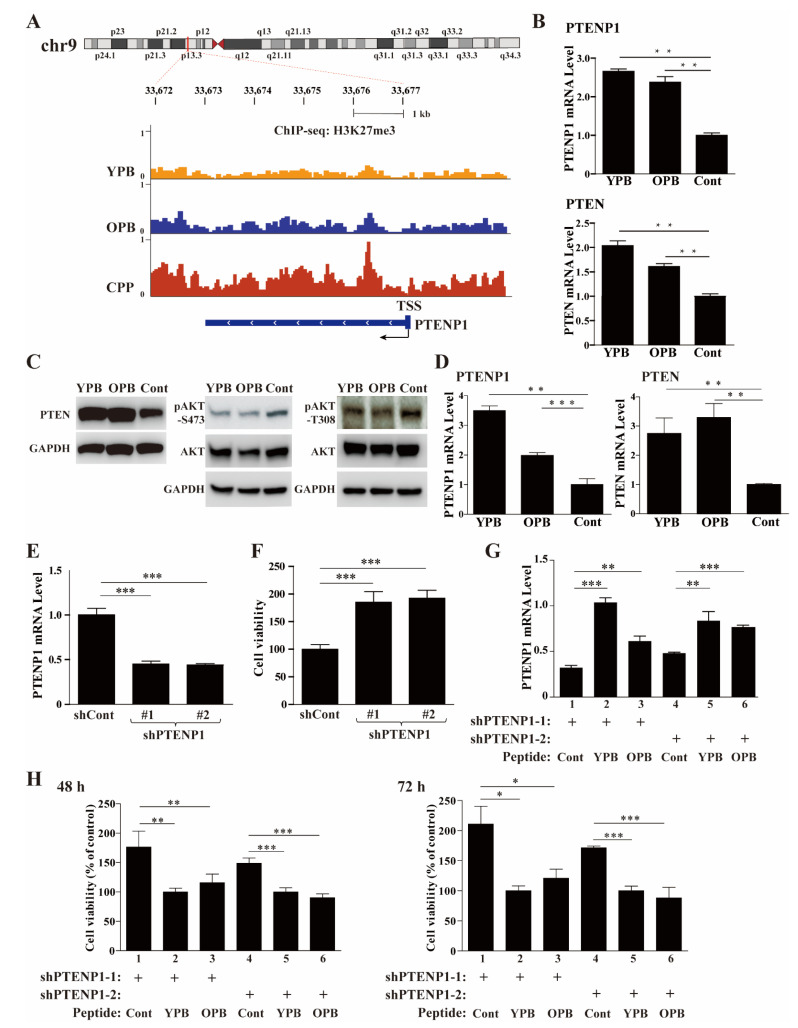
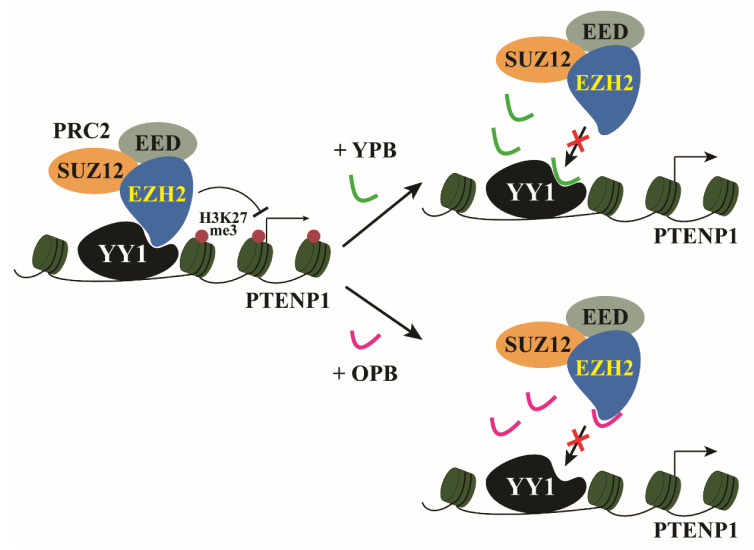
Enhancer of zeste homolog 2 (EZH2) is a methyltransferase to mediate lysine 27 trimethylation in histone H3 (i.e., H3K27me3) and repress gene expression. In solid tumors, EZH2 promotes oncogenesis and is considered a therapeutic target. As a transcription factor, Yin Yang 1 (YY1) recruits EZH2 through its oncoprotein binding (OPB) domain to establish gene repression. In this study, we mapped the YY1 protein binding (YPB) domain on EZH2 to a region of 27 amino acids. Both YPB and OPB domain synthetic peptides could disrupt YY1EZH2 interaction, markedly reduce breast cancer cell viability, and efficiently inhibit tumor growth in a xenograft mouse model. We analyzed MDA-MB-231 cells treated with YPB, OPB, and control peptides by chromatin immunoprecipitation DNA sequencing (ChIP-seq) using an antibody against H3K27me3. YPB and OPB treatments altered H3K27me3 on 465 and 1137 genes, respectively, compared to the control. Of these genes, 145 overlapped between the two peptides. Among them, PTENP1, the PTEN pseudogene, showed reduced H3K27me3 signal when treated by either YPB or OPB peptide. Consistently, the two peptides enhanced both PTENP1 and PTEN expression with concomitantly reduced AKT activation. Further studies validated PTENP1's contribution to the anticancer activity of YPB and OPB peptides.

Keywords: EZH2; OPB; PTENP1; YPB; YY1; breast cancer.


Conflict of interest statement

The authors declare no competing interests.

Figures

Figure 1
Figure 1
Identification of YY1 binding site on EZH2 protein. (A) Schematic diagrams of the domain structures of YY1 and EZH2 proteins based on previous reports [30,39]. In the domain structure of YY1, “Acidic” represents a region containing enriched aspartic and glutamic acids, “His cluster” contains 11 consecutive histidines, “GA” and “GK” depict regions enriched by glycine/alanine and glycine/lysine, respectively; OPB: oncoprotein binding; the Spacer region and Zinc finger domain are also denoted. In the domain structure of EZH2, “DNMT” is the binding domain of DNA methyltransferase 1 (DNMT1), “SANT” denotes the SANT domain regulating chromatin accessibility [40],“CXC” is the cysteine-rich domain, and the SET domain is also denoted. (B) Western blot analyses of endogenous YY1 and EZH2 interaction by co-immunoprecipitation (co-IP). MDA-MB-231 cell lysates (800 µg) were incubated with 2 µg of EZH2 antibody (cat# 5246S, left) or YY1 antibody (cat# sc-281, right), followed by the incubation of Protein A/G beads and extensive washing. The samples were analyzed by Western blot using EZH2 and YY1 antibodies as indicated. (C,F,I) Diagram of EZH2 mutants generated to map its YY1 binding region. The tag is either an HA epitope or GST. (D,E,GI) Co-IP (D,G) and GST-pull down (E,H,J) studies to determine the YY1 binding region on the EZH2 protein. FL: full length; EV: empty vector; IP: immunoprecipitation; Direct WB: Western blot analysis of samples without IP; YPB: YY1 protein binding.
Figure 2
Figure 2
YPB and OPB peptides reduced breast cancer cell viability and disrupted YY1-EZH2 interaction. (A) The design and sequences of the synthetic YPB, OPB, and Cont peptides. FITC: fluorescein isothiocyanate; TAT: a cell-penetrating peptide derived from human immunodeficiency virus. (BE) Inhibitory effects the YPB and OPB peptides on breast cancer cells. MCF-10A, MCF-7, MDA-MB-231, and MDA-MB-453 cells were individually treated with different concentrations of YPB, OPB, and Cont peptides for 48 h, followed by WST-1 assays to determine cell proliferation. Then, cell viability (upper panels) and peptide inhibition ratios (lower panels) were calculated, with the IC50 values in these cell lines embedded in the graphs. (F) Scratch assay to test the effects of PBS, YPB, OPB, and Cont peptides on cell migration. Scratches on the plates with overnight cultured MDA-MB-231 cells were created with immediate addition of PBS, 30 µM of YPB, OPB, and Cont peptides into the medium. The scratches were imaged after 48 h, and the quantitation of cell migration was presented at right. Viability of nontumorigenic MCF-10A cells treated by the 3 peptides. Data represent the mean ± S.D. ** p < 0.01, *** p < 0.001.
Figure 3
Figure 3
Evaluation of apoptosis in breast cancer cells treated by the peptides. (AC) Flow cytometric analyses of breast cancer cells treated by the peptides. MCF-10A (A), MCF-7 (B), MDA-MB-231 (C), and MDA-MB-453 (D) cells were individually treated by PBS, 30 µM of Cont, YPB, and OPB peptides (unlabeled), and 15 µM of tamoxifen for 48 h, followed by the staining of Annexin V-FITC and PI. The apoptotic rates of the treated cells were analyzed by flow cytometry with representative images shown at left and quantitative apoptotic rates calculated by FlowJo software shown at right. Data represent the mean ± S.D. * p < 0.05, ** p < 0.01, *** p < 0.001. (EG) Western blot analyses of apoptotic markers in breast cancer cells treated by the peptides. MCF-7 (E), MDA-MB-231 (F), and MDA-MB-453 (G) cells were treated as described in (AC). The cell lysates were subjected to Western blot analyses using indicated antibodies with GAPDH as a loading control.
Figure 4
Figure 4
Examination of YPB and OPB peptides in blocking YY1-EZH2 interaction, and their subcellular localization. (A,B) Co-IP experiments to determine OPB and YPB interaction with EZH2 and YY1, respectively. In A, 3×Flag-OPB-2A1-EGFP, 3×Flag-Cont-2A1-EGFP expression vectors, and an empty vector were individually cotransfected with HA-EZH2, HA-EZH1 expression vectors, or an empty vector. Cell lysates were co-IPed using Flag antibody followed by Western blot analysis using HA antibody. In B, similar to A but using 3×Flag-YPB-2A1-EGFP and HA-YY1 in the transfection and co-IP studies. (C,D) Examination of YPB and OPB peptides’ effects on YY1-EZH2 interaction. MDA-MB-231 cell lysates were treated by 30 μM of Cont, OPB, and YPB peptides for 4 h, followed by co-IP using 2 µg of normal IgG, YY1, and EZH2 antibodies. The co-IPed samples were analyzed by Western blot using YY1 and EZH2 antibodies to evaluate the effects of YPB (C) and OPB (D) peptides on YY1-EZH2 interaction. (E) Examination of YY1 and EZH2 colocalization in cells. MDA-MB-231 cells were immunostained by YY1 and EZH2 antibodies. DAPI was used to visualize nuclei. (F) Detection of subcellular localization of peptides. MDA-MB-231 cells were treated by 30 μM of Cont, OPB, and YPB peptides for 48 h, followed by DAPI staining. The peptides were all N-terminal FITC-labeled and thus could emit green fluorescence.
Figure 5
Figure 5
Effects of the peptides on breast cancer growth in a xenograft mouse model. (A) The experimental design of the mouse xenograft study. MB-MDA-231 cells (2 × 10⁶) were subcutaneously inoculated at the right or left flank of each BALB/c nude mouse. After the tumors developed to a volume of approximate 60–100 mm3, the mice were randomly divided into 3 groups with 7 mice in each group. The YPB, OPB, and Cont peptides were intratumorally injected into the tumors of the mice in the three groups correspondingly with a dosage of 30 μM in 100 µL per injection and injected every other day for 22 days. The mice were sacrificed 3 days after the last injection. (B,C) Tumor volumes (B) and their relative sizes (C) from the mice in the 3 groups after the initial peptide injection. (D) Image of actual xenograft tumors excised from the mice treated by the peptides. (E,F) The weights and volumes of the excised tumors after the mice were sacrificed. (G) The body weights of the mice in the 3 groups after the initial peptide injections. (HJ) Immunohistochemical analyses of xenograft tumors. Representative images of immunohistochemical staining using antibodies against Ki-67 (H), cleaved caspase3 (I), and cleaved PARP (J) are presented in the left panels, and their quantification was shown in the right panels. The quantification was carried out under 400× magnification in 3 randomly selected areas in each tumor, and the data shown are presented as mean ± SD of 3–5 tumor samples from individual mice in each group. Values represent the mean ± S.D., ** p < 0.01, *** p < 0.001.
Figure 6
Figure 6
Analyses of the H3K27me3 ChIP-seq data in peptide-treated MDA-MB-231 cells. (A) Numbers of genes with altered H3K27me3 ChIP-seq signal in the vicinity (−1000 to +1000 bps) of their TSSs when treated by YPB and OPB peptides, and their overlapped genes. The false discovery rate (FDR) was set as <0.05 and the threshold for the fold of change (FC) of H3K27me3 signal was 1.5. The upward and downward arrows designate the genes with increased or decreased H3K27me3 signal, respectively. The genes with both upward and downward arrows indicate that the genes have both increased and decreased H3K27me3 signal in their vicinity. (B,C) The top 10 GO terms of the GO analyses of the ChIP-seq data in MDA-MB-231 cells treated by YPB (B) and OPB (C) peptides. The analyses included biological process (BP), cell component (CC), and molecular function (MF) categories. (D,E) KEGG pathway enrichment analyses of the ChIP-seq data in MDA-MB-231 cells treated by YPB (D) and OPB (E) peptides.
Figure 7
Figure 7
PTENP1 is one of the primary targets of YPB and OPB peptides in breast cancer cells. (A) Gene browser tracks of the H3K27me3 ChIP-seq at the PTENP1 locus on chromosome 9 (chr9) in the genomic DNA of MDA-MB-231 cells treated by the peptides. The yellow, blue, and red peaks represent the degrees of H3K27me3 enrichment after the treatments for 48 h by 30 µM of the YPB, OPB, and Cont peptides, respectively. The region of the PTENP1 gene is labeled at the bottom panel. TSS: transcription start site. (B,C) Alterations of genes in the AKT pathway in response to the peptide treatments. After the treatment of MDA-MB-231 cells by the YPB, OPB, and Cont peptides, the cell lysates were analyzed by RT-qPCR to evaluate PTENP1 and PTEN transcript levels (B), and by Western blot analysis to determine the levels of PTEN, pAKT-S473, p-AKT-S308, and AKT, with GAPDH as a control (C). (D) Examination of PTENP1 and PTEN expression in xenograft tumors by qPCR. (E,F) Effects of shPTENP1-1 and -2 on the expression of the endogenous PTENP1 transcript (E) and viability (F) of MDA-MB-231 cells. (G,H) Effects of the cotreatments by shPTENP1-1/2 and each of the peptides on the PTENP1 transcript levels (G) and the viability (H) of MDA-MB-231 cells. The cells were infected by lentiviruses carrying either of the shPTENP1-1/2, and then treated for 48 h by 30 µM of the YPB, OPB, and Cont peptides. Relative PTENP1 transcript levels were determined by RT-qPCR, while the cell viability was calculated based on WST-1 assays. All data were normalized against the data of YPB. Each experiment was repeated at least 3 times with representative data presented. Data are shown as the mean ± S.D. * p < 0.05, ** p < 0.01, *** p < 0.001.
Figure 8
Figure 8
Schematic models of the inhibition of PTENP1 expression by the YPB and OPB peptides. In breast cancer cells, YY1 recruits EZH2 and its associated PRC2 to mediate H3K27me3 in the PTENP1 promoter and repress its expression. YPB and OPB can bind either YY1 or EZH2, respectively, to disrupt the recruitment of EZH2 by YY1, leading to reduced H3K27me3 at the PTENP1 and its upregulation.

References

    1. Lund A.H., van Lohuizen M. Epigenetics and cancer. Genes Dev. 2004;18:2315–2335. doi: 10.1101/gad.1232504. - DOI - PubMed
    1. Brown R., Strathdee G. Epigenomics and epigenetic therapy of cancer. Trends Mol. Med. 2002;8:S43–S48. doi: 10.1016/S1471-4914(02)02314-6. - DOI - PubMed
    1. Margueron R., Reinberg D. The Polycomb complex PRC2 and its mark in life. Nature. 2011;469:343–349. doi: 10.1038/nature09784. - DOI - PMC - PubMed
    1. Rajasekhar V.K., Begemann M. Concise review: Roles of polycomb group proteins in development and disease: A stem cell perspective. Stem. Cells. 2007;25:2498–2510. doi: 10.1634/stemcells.2006-0608. - DOI - PubMed
    1. O’Carroll D., Erhardt S., Pagani M., Barton S.C., Surani M.A., Jenuwein T. The polycomb-group gene Ezh2 is required for early mouse development. Mol. Cell Biol. 2001;21:4330–4336. doi: 10.1128/MCB.21.13.4330-4336.2001. - DOI - PMC - PubMed