. 2021 May 16;22(10):5247.
doi: 10.3390/ijms22105247.

BMAL1 Knockdown Leans Epithelial-Mesenchymal Balance toward Epithelial Properties and Decreases the Chemoresistance of Colon Carcinoma Cells

Affiliations

BMAL1 Knockdown Leans Epithelial-Mesenchymal Balance toward Epithelial Properties and Decreases the Chemoresistance of Colon Carcinoma Cells

Yuan Zhang et al. Int J Mol Sci. .

Abstract

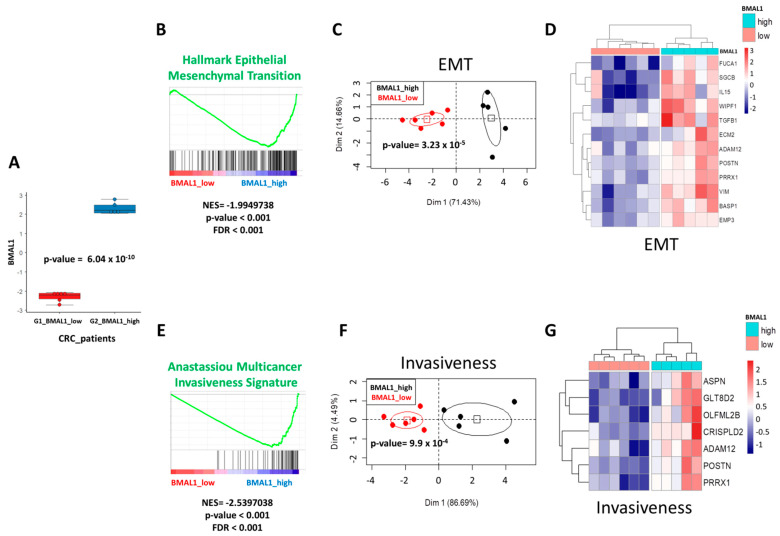
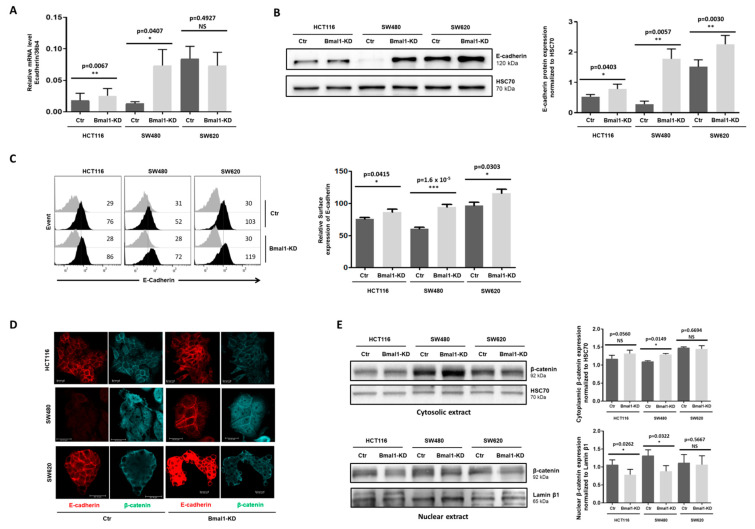
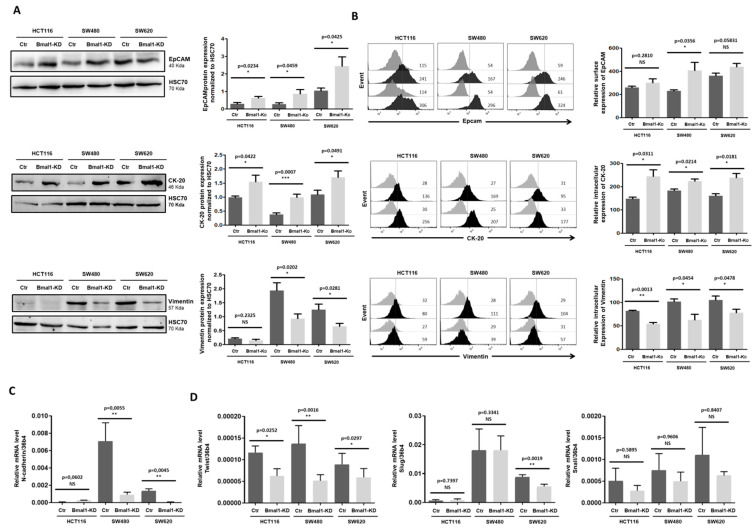
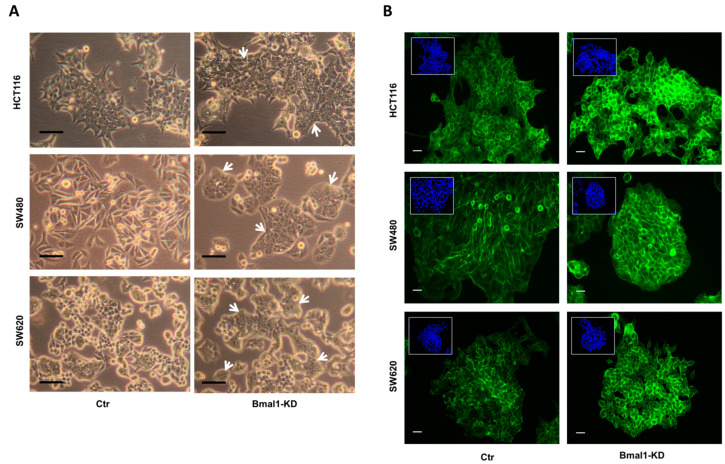
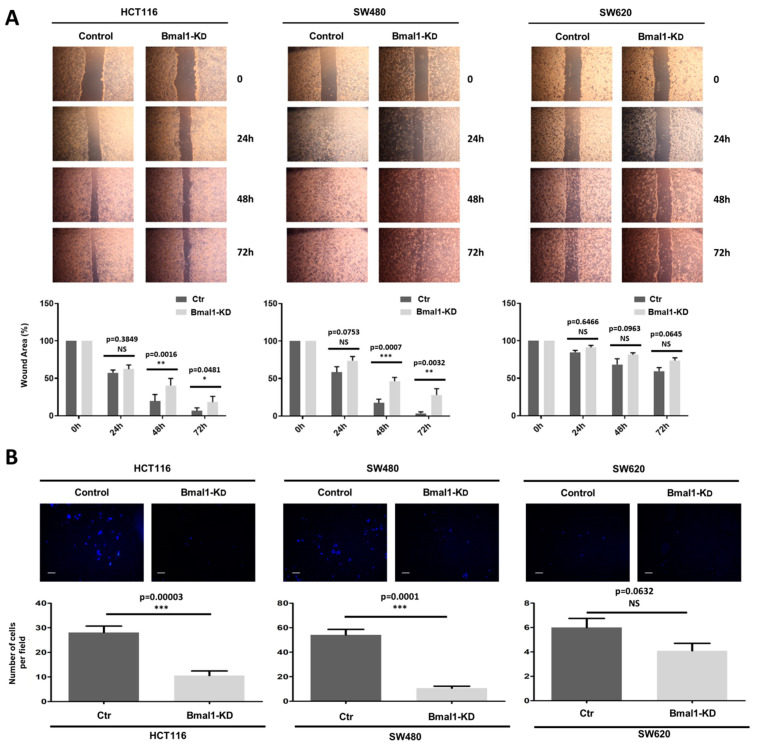
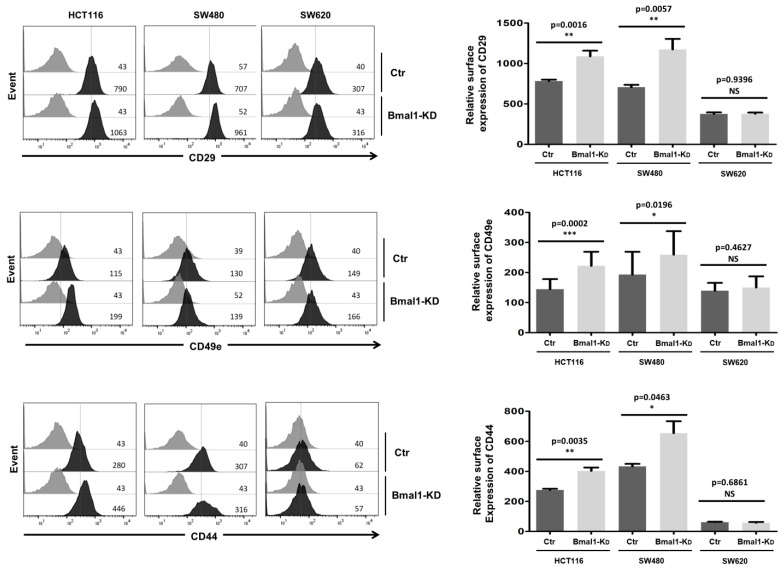
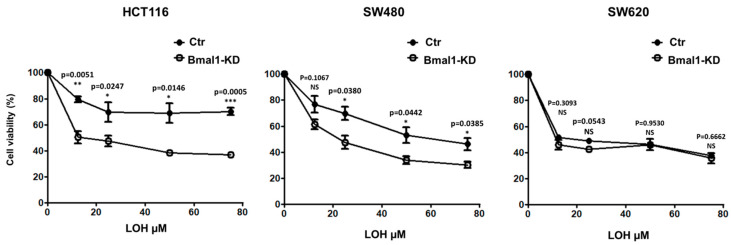
The circadian clock coordinates biological and physiological functions to day/night cycles. The perturbation of the circadian clock increases cancer risk and affects cancer progression. Here, we studied how BMAL1 knockdown (BMAL1-KD) by shRNA affects the epithelial-mesenchymal transition (EMT), a critical early event in the invasion and metastasis of colorectal carcinoma (CRC). In corresponding to a gene set enrichment analysis, which showed a significant enrichment of EMT and invasive signatures in BMAL1_high CRC patients as compared to BMAL1_low CRC patients, our results revealed that BMAL1 is implicated in keeping the epithelial-mesenchymal equilibrium of CRC cells and influences their capacity of adhesion, migration, invasion, and chemoresistance. Firstly, BMAL1-KD increased the expression of epithelial markers (E-cadherin, CK-20, and EpCAM) but decreased the expression of Twist and mesenchymal markers (N-cadherin and vimentin) in CRC cell lines. Finally, the molecular alterations after BMAL1-KD promoted mesenchymal-to-epithelial transition-like changes mostly appeared in two primary CRC cell lines (i.e., HCT116 and SW480) compared to the metastatic cell line SW620. As a consequence, migration/invasion and drug resistance capacities decreased in HCT116 and SW480 BMAL1-KD cells. Together, BMAL1-KD alerts the delicate equilibrium between epithelial and mesenchymal properties of CRC cell lines, which revealed the crucial role of BMAL1 in EMT-related CRC metastasis and chemoresistance.

Keywords: BMAL1; chemoresistance; circadian clock; colorectal cancer; epithelial–mesenchymal transition (EMT); metastasis.


Conflict of interest statement

The authors declare that they have no conflict of interest.

Figures

Figure 1
Figure 1
BMAL1 deregulation in colorectal carcinomas (CRC) is associated to epithelial–mesenchymal transition (EMT) and cancer invasiveness perturbations. (A) Boxplot of mRNA expression (Z-scores, RNAseq) in tumors of CRC with patients stratified on their BMAL1 quantification. (B) Enrichment for hallmark EMT gene sets in CRC tumors of patients with a high level of BMAL1 (NES: Normalized Enrichment Score). (C) Principal component analysis performed with EMT-enriched genes found deregulated in CRC tumor samples. (D) Expression heatmap of EMT genes connected to BMAL1 in CRC tumors. (E) Enrichment of multicancer invasiveness signature in CRC tumors of patients with a high level of BMAL1 (NES: Normalized Enrichment Score). (F) Principal component analysis performed with cancer invasiveness-enriched genes found deregulated in CRC tumor samples. (G) Expression heatmap of cancer invasiveness genes connected to BMAL1 in CRC tumors.
Figure 2
Figure 2
BMAL1-KD increased the plasma membrane colocation of E-cadherin and β-catenin but decreased β-catenin nuclear location. (A) Quantitative RT-PCR assay revealed an increased E-cadherin expression in two primary BMAL1 knockdown (BMAL1-KD) cell lines (n = 4, * p < 0.05, ** p < 0.01) in comparison to control (Ctr) cells. (B) Increased E-cadherin expression in BMAL1-KD CRC cell lines was checked by Western blot. Left, Representative Western blots of 6 independent experiments are shown. Right, Bar charts represents E-cadherin expression normalized to HSC70 (n = 6,* p < 0.05, ** p < 0.01). All data are shown as means ± SEM. (C) Enhanced E-cadherin surface expression on BMAL1-KD CRC cell lines was ascertained by flow cytometry analysis. Left, Representative staining of one experiment are shown. Cell staining with the anti-E-Cadherin antibody is represented by the dark-colored histograms and staining with the isotype-matched control antibody correspond to the gray histograms. At the right of each histogram are shown the mean fluorescence intensity values for each staining. Right, Graphs represent the relative expression of E-cadherin in three independent experiments (* p < 0.05, *** p < 0.001). (D) Confocal laser scanning microscopy showing stainings for E-cadherin (red) and β-catenin (blue). BMAL1-KD promotes elevated levels of E-cadherin and β-catenin at the plasma membrane of both HCT116 and SW480 cells, whereas BMAL1-KD only increased evidently the membrane localization of E-cadherin but not β-catenin in SW620 cells. Scale bars, 20 μm. These data are representative of three independent experiments. (E) Cytoplasmic (upper panels) and nuclear (lower panels) extracts of BMAL1-KD and control (Ctr) cell lines were analyzed by Western blot. Left, Representative stainings of one experiment are shown. Right, Graphs represent the quantification of Western blot signals, corresponding to β-catenin expression normalized to HSC70 (cytoplasmic extracts) or Lamin β1 (nuclear extracts). Data are represented as means ± SEM for 5 independent determinations (* p < 0.05). A significant increase in β-catenin cytoplasmic localization was found in SW480 BMAL1-KD cells. HCT116 BMAL1-KD cells presented an increased tendency of cytoplasmic β-catenin (p = 0.056). A significant decrease in β-catenin nuclear localization (n = 5, * p < 0.05) was found in the SW480 BMAL1-KD and HCT116 BMAL1-KD cell lines.
Figure 3
Figure 3
BMAL1-KD leans epithelial–mesenchymal balance of CRC cells toward epithelial properties. (A) Western blot revealed that BMAL1-KD increased the expression of the epithelial markers EpCAM and cytokeratin-20 (CK-20) and decreased the mesenchymal marker (vimentin) in BMAL1-KD CRC cell lines. HSC70 was used as loading controls. (B) EpCAM surface expression and intracellular expression of vimentin and CK-20 were analyzed by flow cytometry. Left, Representative stainings of one experiment are shown. Staining of the cells with the antigen-specific antibody is represented by the dark-colored histograms and staining with the isotype-matched control antibody correspond to the gray histograms. At the right of each histogram are shown the mean fluorescence intensity values for each staining. Right, Graphs represent the relative expression of EpCAM, CK-20, and vimentin in three independent experiments (* p < 0.05, ** p < 0.01, *** p < 0.001). (C) Quantitative RT-PCR revealed that RNA expression level of mesenchymal hallmarker N-cadherin was significantly decreased in SW480 BMAL1-KD and SW620 BMAL1-KD cell lines. The BMAL1-KD HCT116 cell line exhibited a decreased tendency of N-cadherin (p = 0.0762) (n = 5, ** p < 0.01). Data are shown as means ± SEM. (D) Quantitative RT-PCR analyzed the RNA expression level of three EMT-activating transcription factors Twist, Slug, and Snail in control and BMAL1-KD CRC cell lines. BMAL1-KD decreased significantly the expression of Twist but not Slug and Snail (n = 5, * p < 0.05, ** p < 0.01). Data are shown as means ± SEM.
Figure 4
Figure 4
BMAL1-KD induced morphological changes on CRC cell lines. (A) Cells were viewed using phase contrast microscopy at the objective 20×. Compared to the control (Ctr) cells, CRC cells formed densely packed clones in the three BMAL1-KD CRC cell lines (white arrows). Morphological changes were most prominent in SW480 BMAL1-KD cells, with loss of an elongated and spindle-shaped morphology and acquisition of a typical epithelial shape with a cobblestone-like morphology. Scale bars, 50 μm. (B) F-actin distribution profile was analyzed by fluorescence microscopy with phalloidin (green). Nuclei staining with DAPI (blue) was inserted at the top-left of each image. Scale bars, 15 μm. The F-actin distribution profile was similar to those of E-cadherin and β-catenin in BMAL1-KD CRC cells, revealing a specific honeycomb-like epithelial organization of the adhesion belts delineated by E-cadherin, β-catenin, and F-actin.
Figure 5
Figure 5
BMAL1-KD inhibits cell migration and invasion of CRC cell lines. (A) A scratch-wound healing assay was applied for cell migration assay. Top, Artificial wounds were made in confluent monolayers of control and BMAL1-KD CRC cell lines. Migration of CRC cells towards the wound, photographed from 24 h to 72 h. The top panel shows one of three independent experiments. Bottom, HCT116 BMAL1-KD and SW480 BMAL1-KD cells displayed lower levels of migratory activity in comparison to control cell lines (n = 3, * p < 0.05, ** p < 0.01, *** p < 0.001). No significant differences in migratory activity were observed between BMAL1-KD and control SW620 cells. Data are shown as means ± SEM. (B) Invasion assay. Top, The invasive potential of BMAL1-KD CRC cell lines and their control were analyzed in Matrigel Transwells after 96 h by fluorescence microscopy. DAPI was used to stain the nuclei and to determine the number of invasive cells. A representative image of random fields is shown for each cell type. Scale bar, 50 μm. Bottom, Graphs represent the mean of the number of invaded cells per field in three independent experiments. Only the primary BMAL1-KD CRC cells had a lower invasion capacity than control cells (n = 3, *** p < 0.001). Data are shown as means ± SEM.
Figure 6
Figure 6
BMAL1-KD increased the expression of cell adhesion molecules on CRC cell lines. Flow cytometry analysis of surface expression of CD29 (integrin β1), CD49e (integrin α5), and CD44 adhesion molecules. Left, a representative direct staining of four independent experiments is shown. The dark-colored bars correspond to cells incubated with phycoerythrin (PE)-conjugated antibodies against CD29, CD49e, and CD44, and grey bars correspond to cells incubated with the isotype-matched control antibody. Mean fluorescence intensity values for each marker are shown at the right of each histogram. Right, BMAL1-KD led to increased expression of membranous CD29, CD49e, and CD44, mostly in primary BMAL1-KD CRC cell lines (n = 3, * p < 0.05, ** p < 0.01, *** p < 0.001). Data are shown as means ± SEM.
Figure 7
Figure 7
BMAL1-KD sensitizes CRC cell lines to oxaliplatin treatment. The sensitivity of CRC cells to oxaliplatin (LOH) drug was evaluated by the MTT cell viability assay. BMAL1-KD and their control cells were treated for 24 h to 48 h with increasing concentrations of LOH (from 12.5 to 75 μM). Cell viability after drug treatment is presented as a percentage relative to untreated cells. The mean values for three experiments are shown; error bars correspond to 95% confidence intervals. BMAL1-KD led to a distinct decrease in cell viability of HCT116 and SW480 cell lines under LOH treatment compared to their control cells, whereas no significant differences were observed with the metastasis SW620 cell line (n = 3, * p < 0.05, ** p < 0.01, *** p < 0.001). Data are shown as means ± SEM.

Similar articles

Cited by

References

    1. Siegel R.L., Medhanie G.A., Fedewa S.A., Jemal A. State Variation in Early-Onset Colorectal Cancer in the United States, 1995–2015. J. Natl. Cancer Inst. 2019;111:1104–1106. doi: 10.1093/jnci/djz098. - DOI - PMC - PubMed
    1. Zhang Y., Ma J., Zhang S., Deng G., Wu X., He J., Pei H., Shen H., Zeng S. A prognostic analysis of 895 cases of stage III colon cancer in different colon subsites. Int. J. Color. Dis. 2015;30:1173–1183. doi: 10.1007/s00384-015-2273-z. - DOI - PubMed
    1. Thiery J.P., Acloque H., Huang R.Y.J., Nieto M.A. Epithelial-Mesenchymal Transitions in Development and Disease. Cell. 2009;139:871–890. doi: 10.1016/j.cell.2009.11.007. - DOI - PubMed
    1. Zhang J., Tian X.-J., Xing J. Signal Transduction Pathways of EMT Induced by TGF-β, SHH, and WNT and Their Crosstalks. J. Clin. Med. 2016;5:41. doi: 10.3390/jcm5040041. - DOI - PMC - PubMed
    1. Jeanes A., Gottardi C.J., Yap A.S. Cadherins and cancer: How does cadherin dysfunction promote tumor progression? Oncogene. 2008;27:6920–6929. doi: 10.1038/onc.2008.343. - DOI - PMC - PubMed

MeSH terms