Mast Cell Proteases Tryptase and Chymase Induce Migratory and Morphological Alterations in Bronchial Epithelial Cells
- PMID: 34065716
- PMCID: PMC8156481
- DOI: 10.3390/ijms22105250
Mast Cell Proteases Tryptase and Chymase Induce Migratory and Morphological Alterations in Bronchial Epithelial Cells
Abstract
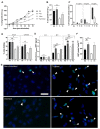
Chronic respiratory diseases are often characterized by impaired epithelial function and remodeling. Mast cells (MCs) are known to home into the epithelium in respiratory diseases, but the MC-epithelial interactions remain less understood. Therefore, this study aimed to investigate the effect of MC proteases on bronchial epithelial morphology and function. Bronchial epithelial cells were stimulated with MC tryptase and/or chymase. Morphology and epithelial function were performed using cell tracking analysis and holographic live-cell imaging. Samples were also analyzed for motility-associated gene expression. Immunocytochemistry was performed to compare cytoskeletal arrangement. Stimulated cells showed strong alterations on gene, protein and functional levels in several parameters important for maintaining epithelial function. The most significant increases were found in cell motility, cellular speed and cell elongation compared to non-stimulated cells. Also, cell morphology was significantly altered in chymase treated compared to non-stimulated cells. In the current study, we show that MC proteases can induce cell migration and morphological and proliferative alterations in epithelial cells. Thus, our data imply that MC release of proteases may play a critical role in airway epithelial remodeling and disruption of epithelial function.
Keywords: bronchial epithelial cells; chymase; holomonitor; mast cell; migration; morphology; proliferation; tryptase.
Conflict of interest statement
The authors declare no conflict of interest.
Figures


Similar articles
-
Mast Cell Tryptase Promotes Airway Remodeling by Inducing Anti-Apoptotic and Cell Growth Properties in Human Alveolar and Bronchial Epithelial Cells.Cells. 2023 May 22;12(10):1439. doi: 10.3390/cells12101439. Cells. 2023. PMID: 37408273 Free PMC article.
-
Direct effects of mast cell proteases, tryptase and chymase, on bronchial epithelial integrity proteins and anti-viral responses.BMC Immunol. 2021 Jun 2;22(1):35. doi: 10.1186/s12865-021-00424-w. BMC Immunol. 2021. PMID: 34078278 Free PMC article.
-
Mast cell chymase impairs bronchial epithelium integrity by degrading cell junction molecules of epithelial cells.Allergy. 2019 Jul;74(7):1266-1276. doi: 10.1111/all.13666. Epub 2018 Dec 9. Allergy. 2019. PMID: 30428129
-
Role of mast cell proteases in tissue remodeling.Chem Immunol Allergy. 2005;87:80-84. doi: 10.1159/000087572. Chem Immunol Allergy. 2005. PMID: 16107764 Review.
-
Mast cell chymase and tryptase in abdominal aortic aneurysm formation.Trends Cardiovasc Med. 2012 Aug;22(6):150-5. doi: 10.1016/j.tcm.2012.07.012. Epub 2012 Aug 14. Trends Cardiovasc Med. 2012. PMID: 22902093 Free PMC article. Review.
Cited by
-
Activating mutations remodel the chromatin accessibility landscape to drive distinct regulatory networks in KMT2A-rearranged acute leukemia.Hemasphere. 2024 Sep 26;8(9):e70006. doi: 10.1002/hem3.70006. eCollection 2024 Sep. Hemasphere. 2024. PMID: 39329074 Free PMC article.
-
New Mechanistic Advances in FcεRI-Mast Cell-Mediated Allergic Signaling.Clin Rev Allergy Immunol. 2022 Dec;63(3):431-446. doi: 10.1007/s12016-022-08955-9. Epub 2022 Oct 17. Clin Rev Allergy Immunol. 2022. PMID: 36251242 Free PMC article. Review.
-
Mast Cell Tryptase Promotes Airway Remodeling by Inducing Anti-Apoptotic and Cell Growth Properties in Human Alveolar and Bronchial Epithelial Cells.Cells. 2023 May 22;12(10):1439. doi: 10.3390/cells12101439. Cells. 2023. PMID: 37408273 Free PMC article.
-
Mast Cells in Upper and Lower Airway Diseases: Sentinels in the Front Line.Int J Mol Sci. 2023 Jun 5;24(11):9771. doi: 10.3390/ijms24119771. Int J Mol Sci. 2023. PMID: 37298721 Free PMC article. Review.
-
A single-cell spatial chart of the airway wall reveals proinflammatory cellular ecosystems and their interactions in health and asthma.Nat Immunol. 2025 Jun;26(6):920-933. doi: 10.1038/s41590-025-02161-3. Epub 2025 May 21. Nat Immunol. 2025. PMID: 40399607 Free PMC article.
References
-
- Enerbäck L., Enerbäck L., Norrby K., Norrby K. The Mast Cells. Curr. Top Pathol. 1989;79:169–204. - PubMed
MeSH terms
Substances
Grants and funding
LinkOut - more resources
Full Text Sources

