

Nutrient Deficiency Promotes the Entry of Helicobacter pylori Cells into Candida Yeast Cells
- PMID: 34065788
- PMCID: PMC8151769
- DOI: 10.3390/biology10050426
Nutrient Deficiency Promotes the Entry of Helicobacter pylori Cells into Candida Yeast Cells
Abstract
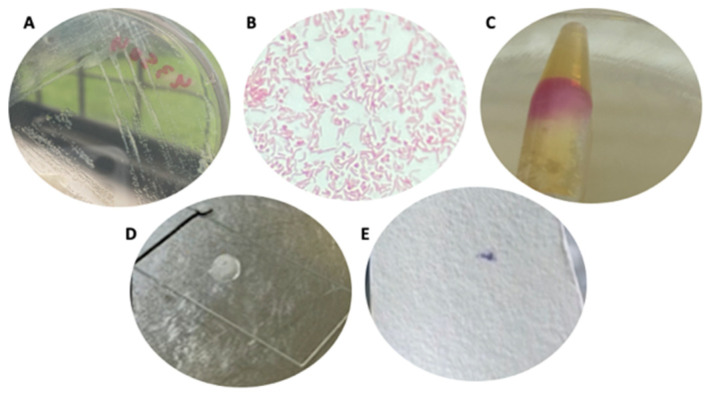
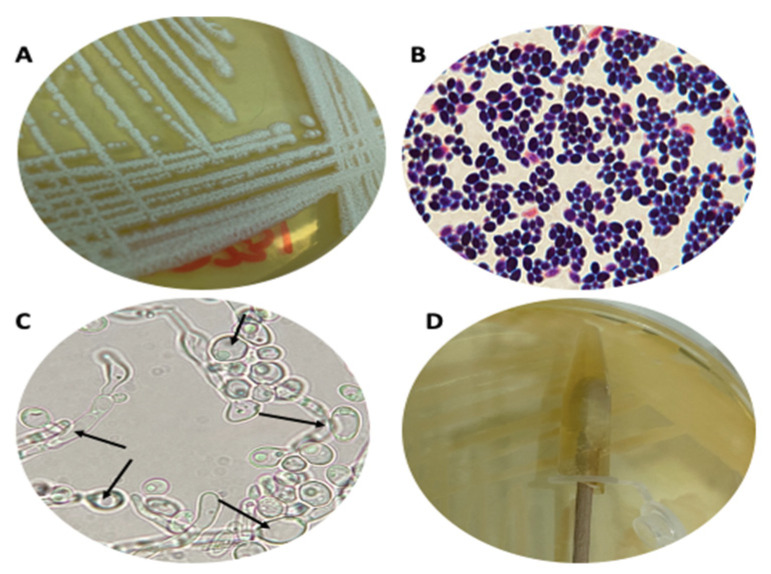
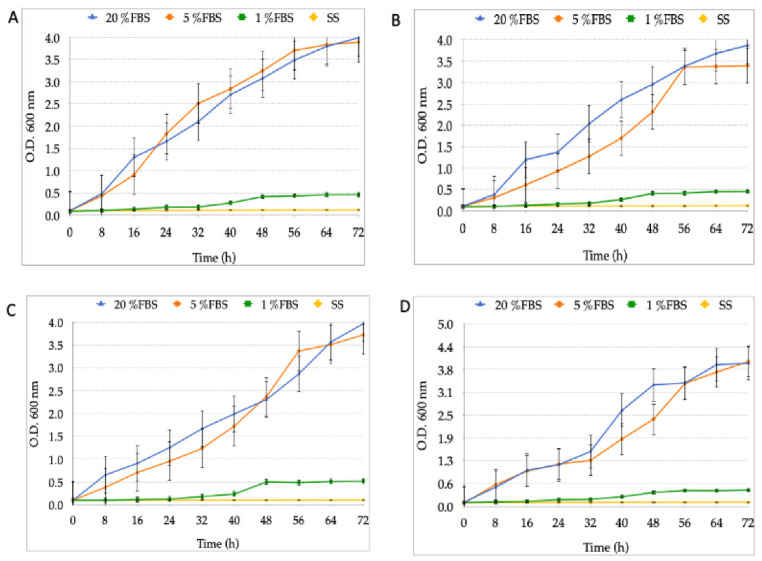
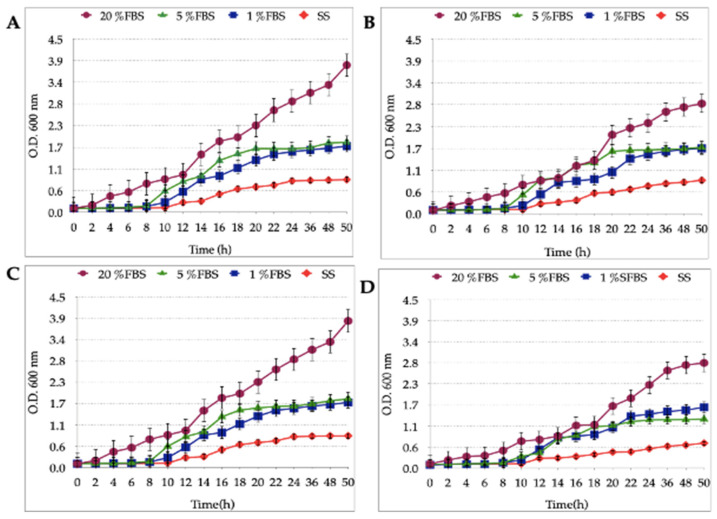
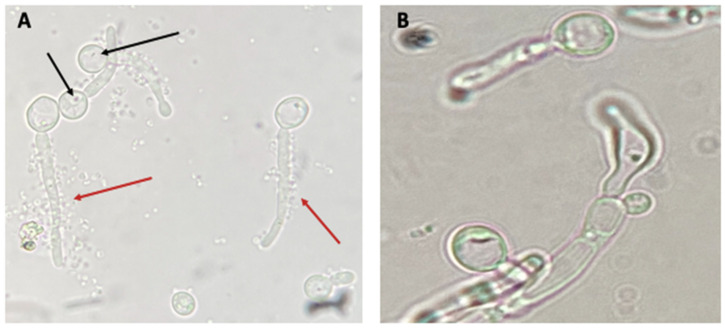
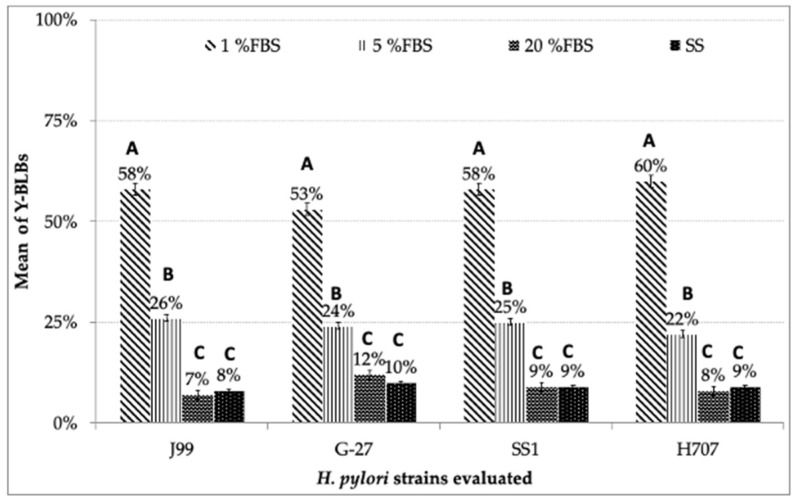
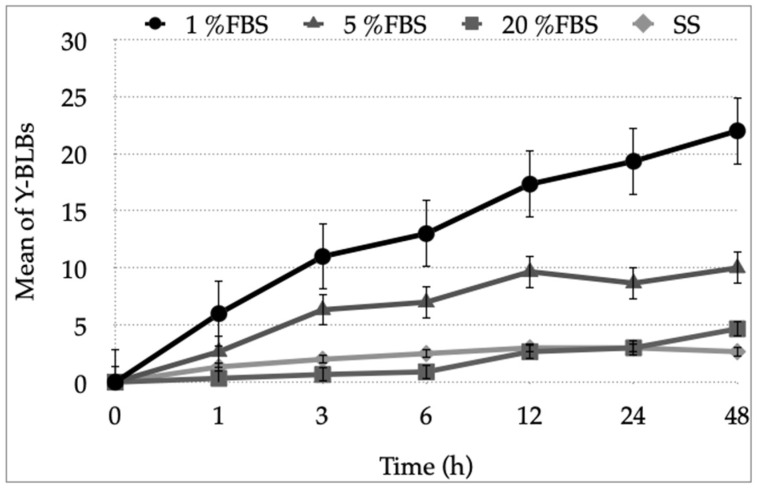
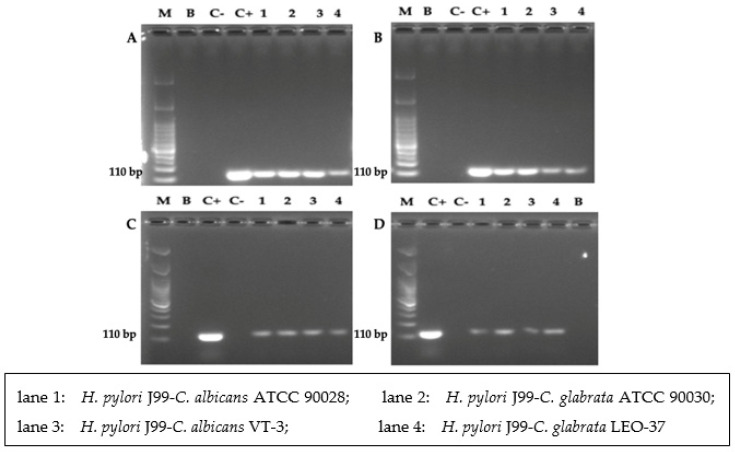
Helicobacter pylori, a Gram-negative bacterium, has as a natural niche the human gastric epithelium. This pathogen has been reported to enter into Candida yeast cells; however, factors triggering this endosymbiotic relationship remain unknown. The aim of this work was to evaluate in vitro if variations in nutrient concentration in the cultured medium trigger the internalization of H. pylori within Candida cells. We used H. pylori-Candida co-cultures in Brucella broth supplemented with 1%, 5% or 20% fetal bovine serum or in saline solution. Intra-yeast bacteria-like bodies (BLBs) were observed using optical microscopy, while intra-yeast BLBs were identified as H. pylori using FISH and PCR techniques. Intra-yeast H. pylori (BLBs) viability was confirmed using the LIVE/DEAD BacLight Bacterial Viability kit. Intra-yeast H. pylori was present in all combinations of bacteria-yeast strains co-cultured. However, the percentages of yeast cells harboring bacteria (Y-BLBs) varied according to nutrient concentrations and also were strain-dependent. In conclusion, reduced nutrients stresses H. pylori, promoting its entry into Candida cells. The starvation of both H. pylori and Candida strains reduced the percentages of Y-BLBs, suggesting that starving yeast cells may be less capable of harboring stressed H. pylori cells. Moreover, the endosymbiotic relationship between H. pylori and Candida is dependent on the strains co-cultured.
Keywords: Candida; Helicobacter pylori; endosymbiosis; fetal bovine serum; intracellular H. pylori; nutrient deficiency; starvation.
Conflict of interest statement
The authors declare no conflict of interest.
Figures


Similar articles
-
An Anaerobic Environment Drives the Harboring of Helicobacter pylori within Candida Yeast Cells.Biology (Basel). 2022 May 12;11(5):738. doi: 10.3390/biology11050738. Biology (Basel). 2022. PMID: 35625466 Free PMC article.
-
Temperatures Outside the Optimal Range for Helicobacter pylori Increase Its Harboring within Candida Yeast Cells.Biology (Basel). 2021 Sep 15;10(9):915. doi: 10.3390/biology10090915. Biology (Basel). 2021. PMID: 34571792 Free PMC article.
-
Intracellular presence of Helicobacter pylori antigen and genes within gastric and vaginal Candida.PLoS One. 2024 Feb 8;19(2):e0298442. doi: 10.1371/journal.pone.0298442. eCollection 2024. PLoS One. 2024. PMID: 38329956 Free PMC article.
-
Vacuoles of Candida yeast as a specialized niche for Helicobacter pylori.World J Gastroenterol. 2014 May 14;20(18):5263-73. doi: 10.3748/wjg.v20.i18.5263. World J Gastroenterol. 2014. PMID: 24833856 Free PMC article. Review.
-
Co-Occurrence of Helicobacter pylori and Candida spp. Infections in the Pathogenesis of Gastrointestinal Diseases.Biomedicines. 2025 May 11;13(5):1172. doi: 10.3390/biomedicines13051172. Biomedicines. 2025. PMID: 40426999 Free PMC article. Review.
Cited by
-
An Anaerobic Environment Drives the Harboring of Helicobacter pylori within Candida Yeast Cells.Biology (Basel). 2022 May 12;11(5):738. doi: 10.3390/biology11050738. Biology (Basel). 2022. PMID: 35625466 Free PMC article.
-
Helicobacter pylori in the Oral Cavity: Current Evidence and Potential Survival Strategies.Int J Mol Sci. 2022 Nov 7;23(21):13646. doi: 10.3390/ijms232113646. Int J Mol Sci. 2022. PMID: 36362445 Free PMC article. Review.
-
Temperatures Outside the Optimal Range for Helicobacter pylori Increase Its Harboring within Candida Yeast Cells.Biology (Basel). 2021 Sep 15;10(9):915. doi: 10.3390/biology10090915. Biology (Basel). 2021. PMID: 34571792 Free PMC article.
-
Surface adherence and vacuolar internalization of bacterial pathogens to the Candida spp. cells: Mechanism of persistence and propagation.J Adv Res. 2023 Nov;53:115-136. doi: 10.1016/j.jare.2022.12.013. Epub 2022 Dec 23. J Adv Res. 2023. PMID: 36572338 Free PMC article. Review.
-
Gastric microbiota dysbiosis and Helicobacter pylori infection.Front Microbiol. 2023 Mar 30;14:1153269. doi: 10.3389/fmicb.2023.1153269. eCollection 2023. Front Microbiol. 2023. PMID: 37065152 Free PMC article. Review.
References
-
- Den Hollander W.J., Holster I.L., den Hoed C.M., Capelle L.G., Tang T.J., Anten M.-P., Prytz-Berset I., Witteman E.M., ter Borg F., Hartog G.d., et al. Surveillance of premalignant gastric lesions: A multicentre prospective cohort study from low incidence regions. Gut. 2019;68:585. doi: 10.1136/gutjnl-2017-314498. - DOI - PubMed
-
- Banks M., Graham D., Jansen M., Gotoda T., Coda S., di Pietro M., Uedo N., Bhandari P., Pritchard D.M., Kuipers E.J., et al. British Society of Gastroenterology guidelines on the diagnosis and management of patients at risk of gastric adenocarcinoma. Gut. 2019;68:1545–1575. doi: 10.1136/gutjnl-2018-318126. - DOI - PMC - PubMed
Grants and funding
LinkOut - more resources
Full Text Sources
