. 2021 May 12;22(10):5101.
doi: 10.3390/ijms22105101.

Sensitive High-Throughput Assays for Tumour Burden Reveal the Response of a Drosophila melanogaster Model of Colorectal Cancer to Standard Chemotherapies

Affiliations

Sensitive High-Throughput Assays for Tumour Burden Reveal the Response of a Drosophila melanogaster Model of Colorectal Cancer to Standard Chemotherapies

Jamie Adams et al. Int J Mol Sci. .

Abstract

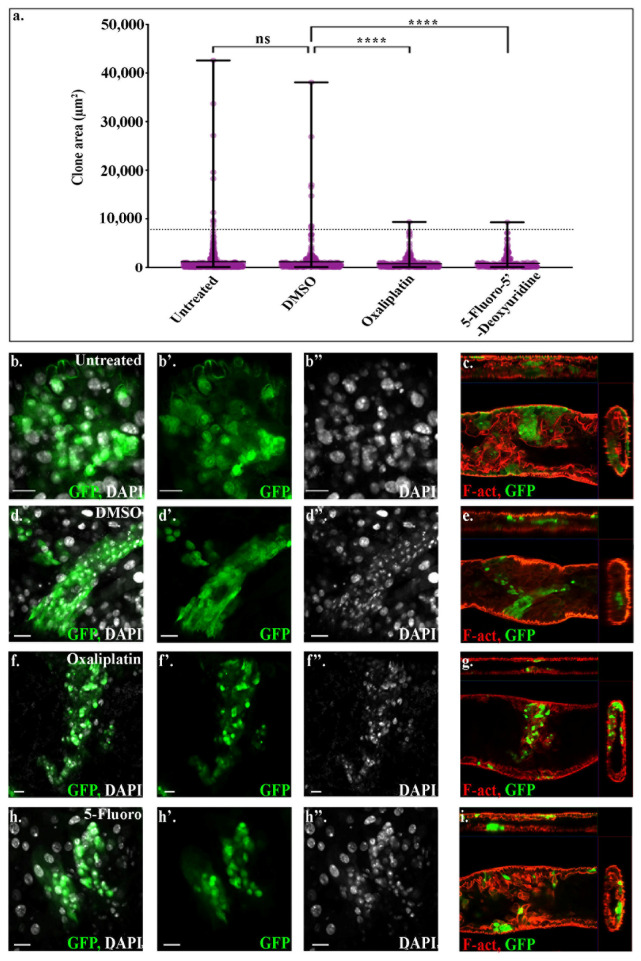
Drosophila melanogaster (Drosophila) models of cancer are emerging as powerful tools to investigate the basic mechanisms underlying tumour progression and identify novel therapeutics. Rapid and inexpensive, it is possible to carry out genetic and drug screens at a far larger scale than in vertebrate organisms. Such whole-organism-based drug screens permits assessment of drug absorption and toxicity, reducing the possibility of false positives. Activating mutations in the Wnt and Ras signalling pathways are common in many epithelial cancers, and when driven in the adult Drosophila midgut, it induces aggressive intestinal tumour-like outgrowths that recapitulate many aspects of human colorectal cancer (CRC). Here we have taken a Drosophila CRC model in which tumourous cells are marked with both GFP and luciferase reporter genes, and developed novel high-throughput assays for quantifying tumour burden. Leveraging these assays, we find that the Drosophila CRC model responds rapidly to treatment with standard CRC-drugs, opening the door to future rapid genetic and drug screens.

Keywords: Drosophila; colorectal cancer; drug screening; high-throughput.


Conflict of interest statement

The authors declare no conflict of interest.

Figures

Figure 1
Figure 1
Assessing tumour burden by assaying for luciferase activity in whole flies. (a) Adult midguts dissected either 1 week (left), or 4 weeks after clone induction (right), stained for GFP (green) and phalloidin (red). By 4 weeks ApcRas clones form large tumours in the anterior region of the midgut. (b) Schematic showing how luciferase assays are performed. Flies are homogenised in a passive lysis buffer, which is then pipetted into a 96-well plate. Luciferin is added and the resultant light is registered and processed via a plate-reader. (c) Luciferase assays performed on 30 flies individually, in pairs, as groups of 5 and in groups of 10, respectively. (d) Luciferase assays performed on 3 batches of 10 control flies with wildtype clones, or of flies bearing ApcRas clones. Graphs show violin plots with the median (solid line) and upper and lower quartiles (dashed lines). Statistical analysis (c) is one-way ANOVA and (d) a Kruskall–Wallis test **** p ≤ 0.0001; *** p ≤ 0.001; ns = non-significant. Scale bars = 500 μm.
Figure 2
Figure 2
Tumour burden can be analysed automatedly across the entire midgut. (a,b) dissected adult midguts are stained for GFP (green) and phalloidin (red). (a) GFP labelled clones 2 and 3 weeks after clone induction in Control and ApcRas conditions. (b,b’) GFP positive areas across whole guts can be accurately selected using custom automated scripts. Blown-up image sections are outlined by dashed white-lines. (c,d) Quantifications of the GFP% coverage of the anterior-portion of the midgut (c) and GFP% coverage of the entire midgut (d) of control, and ApcRas clones at 2 and 3 weeks, n = 10. Graphs show violin plots with the median (solid line) and upper and lower quartiles (dashed lines). Statistical analysis is Kruskall–Wallis test. ** p ≤ 0.01; ns = non-significant. Scale bars = 500 μm (whole guts) and 50 μm (close-ups in b).
Figure 3
Figure 3
Distinguishing between control, over-proliferating and tumour-like clones. (af) representative clones from control, UAS-Sna and ApcRas midguts stained for GFP (green) ((a’,c’,e’) show GFP alone) and Dapi ((a,a’’,c,c’’,e,e’’) white) or phalloidin ((b,d,f) red). (a,c,e) longitudinal sections and (b,d,f) orthogonal views of control (a,b) UAS-Sna (c,d) and ApcRas (e,f) midguts. While the lumen of midguts containing either control or over-proliferating clones consist of a single-layered epithelium and are continuous and clear (b,d), there is multi-layering in the epithelium of midguts with ApcRas clones, which often have luminal-blockages and a discontinued lumen (f). (g,h) Graphs showing scatter plots with min and max ((g) solid horizontal lines) and violin plots with the median ((h) solid line) and upper and lower quartiles ((h) dashed lines). (g) Quantifications of the area of clones found in midguts with either Control, UAS-Sna or ApcRas clones. Clones of over 7800 μm2 (dashed line delineates this threshold) are only found in the ApcRas model. Statistics were performed on the number of clones found over the threshold. (h) The average area of the whole midgut is not significantly altered in any of the conditions. Statistical analysis was a Kruskall–Wallis test. **** p ≤ 0.0001; ns = non-significant. Scale bars = 20 μm.
Figure 4
Figure 4
Treatment with Oxal or 5-Fluoro decreases primary tumour burden. (a) Schematic of the drug treatment regimen. Flies are heat-shocked (day ‘0’) and left on untreated food for 1 week, followed by transfer to a food containing drugs for 2 weeks. The flies are then sacrificed and assayed for tumour burden. (b) Luciferase assays performed on 3 batches of 10 ApcRas flies 3 weeks after clone induction, treated with food either without anything added (Untreated), with DMSO alone (DMSO) or with drugs added that were dissolved in DMSO (Oxal) or (5-Fluoro). (c) Survival curves for control (solid lines) and ApcRas (dotted lines) flies fed on untreated food (blue) or on food with DMSO alone (red), Oxal (orange) or 5-Fluoro (grey) added with DMSO. The survival of the flies was monitored over the 21 days of each experiment. Numbers were the same for each genotype: untreated n = 80, DMSO n = 78, Oxal n =80, 5-Fluoro n =82. (d) Dissected midguts from either control or ApcRas flies stained for GFP (green) and phalloidin (red). (e,f) Quantifications of the GFP% coverage of the entire midgut (e) or of the just the anterior-portion of the midgut (f) of control (Con) or ApcRas (AR) clones at 3 weeks on the different drug regimens, n = 10 for each condition. Graphs show violin plots with the median (solid line) and upper and lower quartiles (dashed lines). Statistical analysis is Kruskall–Wallis test. ** p ≤ 0.01; * p ≤ 0.05; ns = non-significant. Scale bars = 500 μm.
Figure 5
Figure 5
Treatment with either Oxal or 5′-Fluoro results in a decrease in tumour-like clones in the ApcRas model. (a) Quantifications of the area of clones found in midguts of ApcRas clones on different drug regimens. Data is displayed as a scatter plot with min and max ((a) solid horizontal lines) and a dashed line delineating 7800 μm2, clones larger than which are normally only found in tumourigenic conditions. While many clones over 7800 μm2 are found in ApcRas flies in untreated or DMSO conditions, when treated with Oxal or 5-Fluoro clones larger than 7800 μm2 are rarely found. Statistics were performed on the number of clones found over the threshold. (bi) Representative ApcRas clones in flies fed with untreated food (b,c) food with DMSO (d,e) with Oxal (f,g) or with 5′-Fluoro (h,i). (b,d,f,h) are longitudinal sections and (c,e,g,i) orthogonal views. (b’,d’,f’,h’) show GFP alone; (b’’,d’’,f’’,h’’) show DAPI alone. (ci) ApcRas flies treated with Oxal or 5-Fluoro show reduced formation of tumour-like clones, multilayering and luminal blockages. Statistical analysis is Kruskall–Wallis test. **** p ≤ 0.0001; ns = non-significant. Scale bars = 50.

Similar articles

Cited by

References

    1. World Cancer Report: Cander Research for Cancer Prevention. International Agency for Research on Cancer; Lyon, France: 2020.
    1. Geng F., Wang Z., Yin H., Yu J., Cao B. Molecular Targeted Drugs and Treatment of Colorectal Cancer: Recent Progress and Future Perspectives. Cancer Biother. Radiopharm. 2017;32:149–160. doi: 10.1089/cbr.2017.2210. - DOI - PubMed
    1. Tredan O., Galmarini C.M., Patel K., Tannock I.F. Drug resistance and the solid tumor microenvironment. J. Natl. Cancer Inst. 2007;99:1441–1454. doi: 10.1093/jnci/djm135. - DOI - PubMed
    1. Mármol I., Virumbrales-Muñoz M., Quero J., Sánchez-de-Diego C., Fernández L., Ochoa I., Cerrada E., Yoldi M.J.R. Alkynyl gold(I) complex triggers necroptosis via ROS generation in colorectal carcinoma cells. J. Inorg. Biochem. 2017;176:123–133. doi: 10.1016/j.jinorgbio.2017.08.020. - DOI - PubMed
    1. Rowehl R.A., Burke S., Bialkowska A.B., Pettet D.W., 3rd, Rowehl L., Li E., Antoniou E., Zhang Y., Bergamaschi R., Shroyer K.R., et al. Establishment of highly tumorigenic human colorectal cancer cell line (CR4) with properties of putative cancer stem cells. PLoS ONE. 2014;9:e99091. doi: 10.1371/journal.pone.0099091. - DOI - PMC - PubMed

MeSH terms

LinkOut - more resources