. 2021 May 12;13(10):2314.
doi: 10.3390/cancers13102314.

Orai3-Mediates Cisplatin-Resistance in Non-Small Cell Lung Cancer Cells by Enriching Cancer Stem Cell Population through PI3K/AKT Pathway

Affiliations

Orai3-Mediates Cisplatin-Resistance in Non-Small Cell Lung Cancer Cells by Enriching Cancer Stem Cell Population through PI3K/AKT Pathway

Hiba Abou Daya et al. Cancers (Basel). .

Abstract

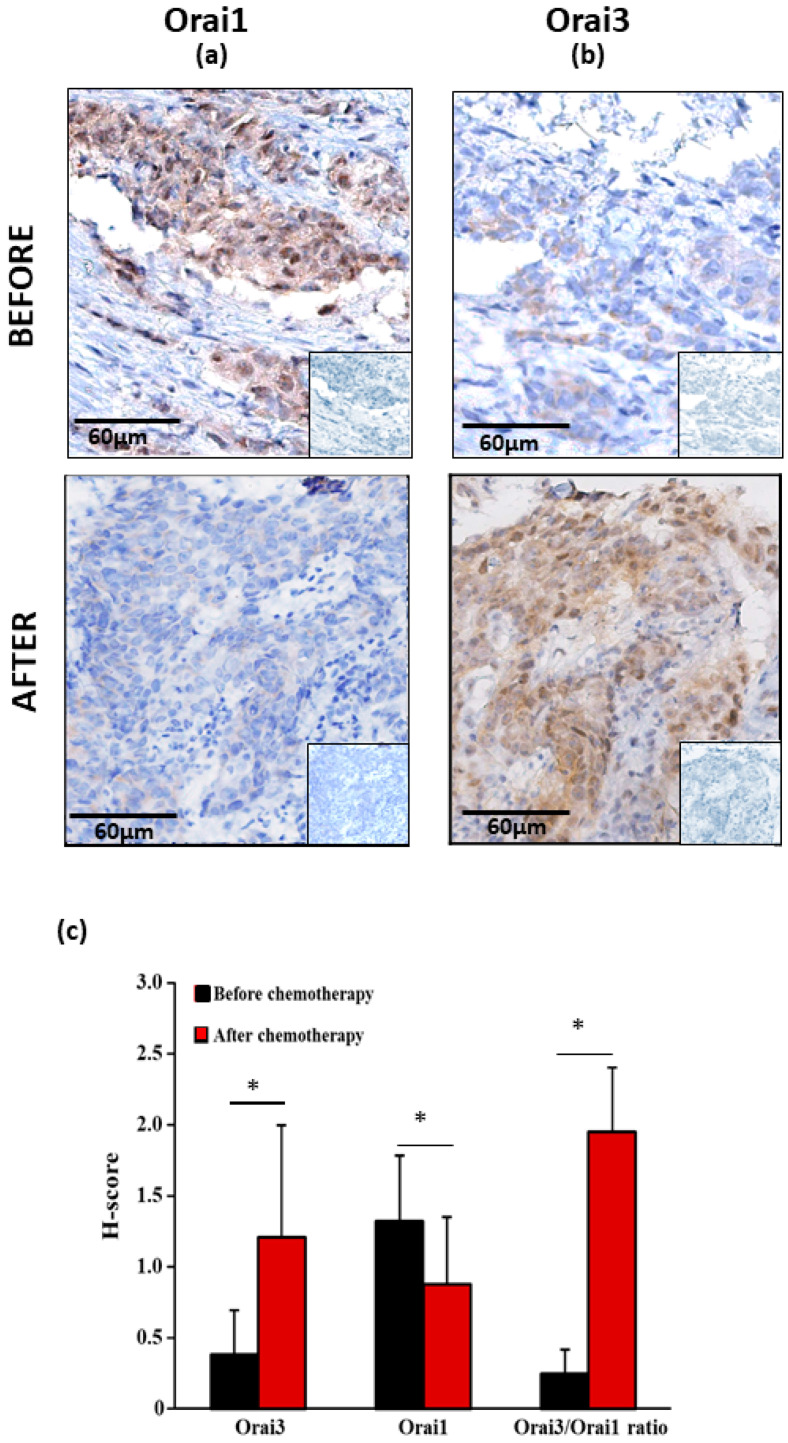
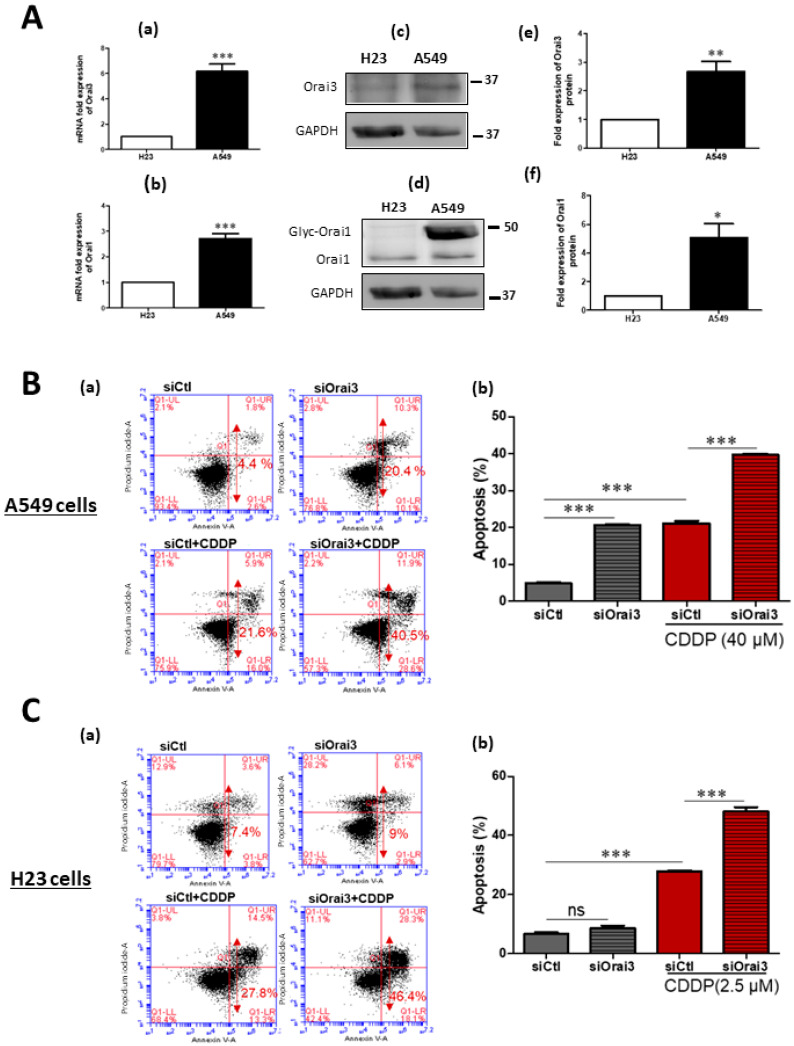
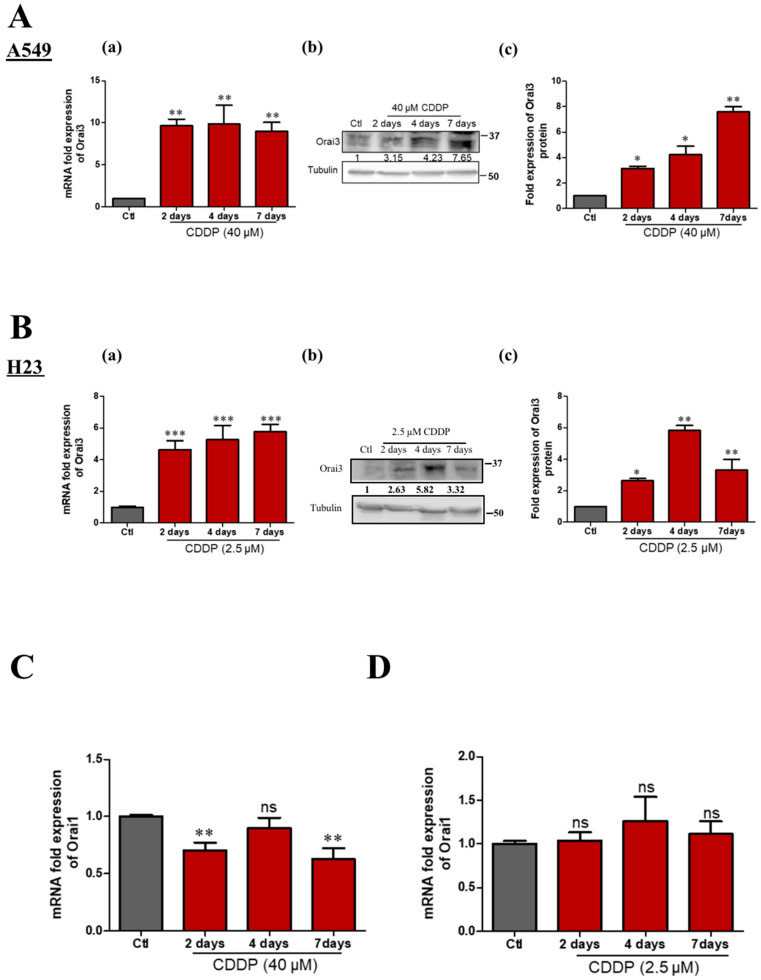
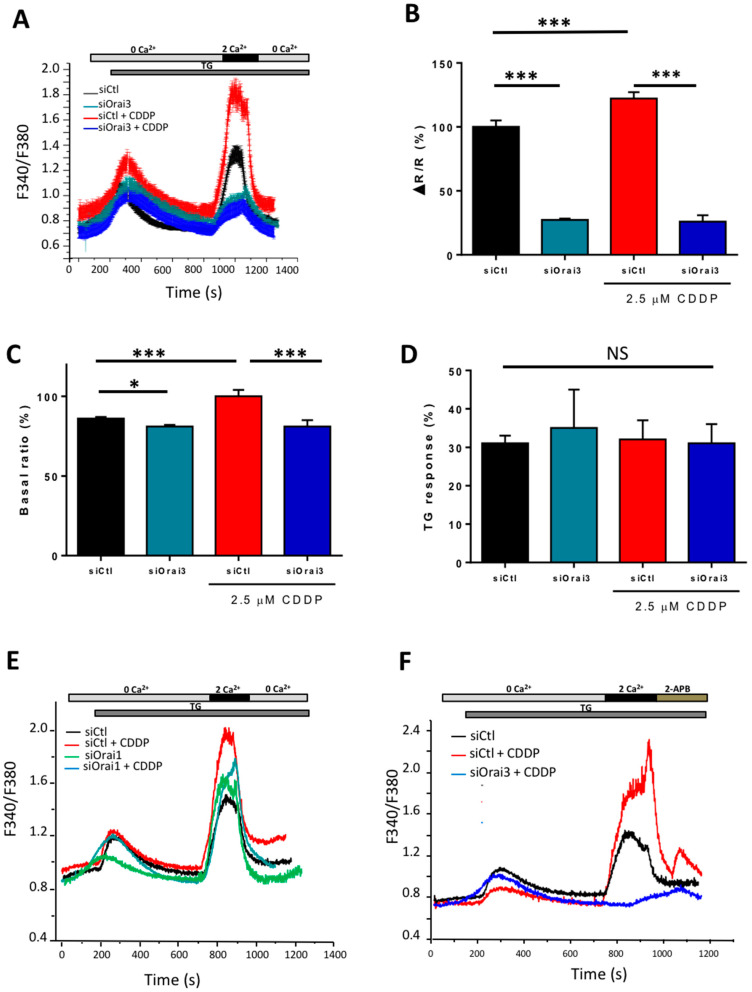
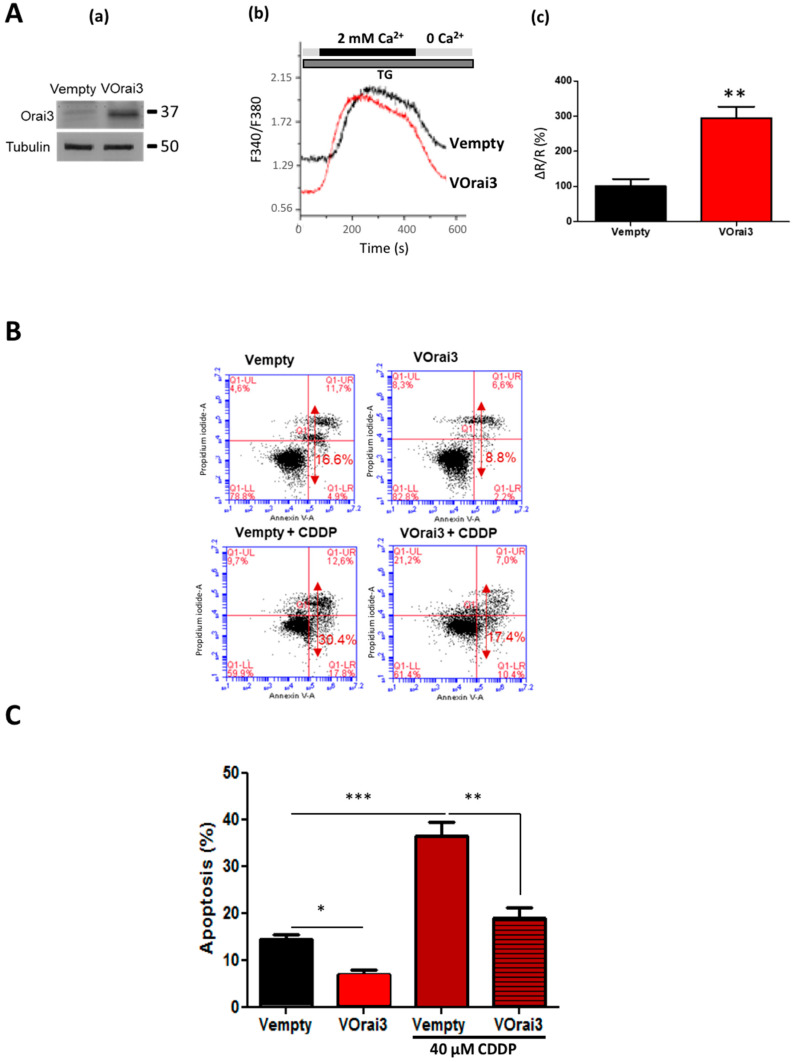
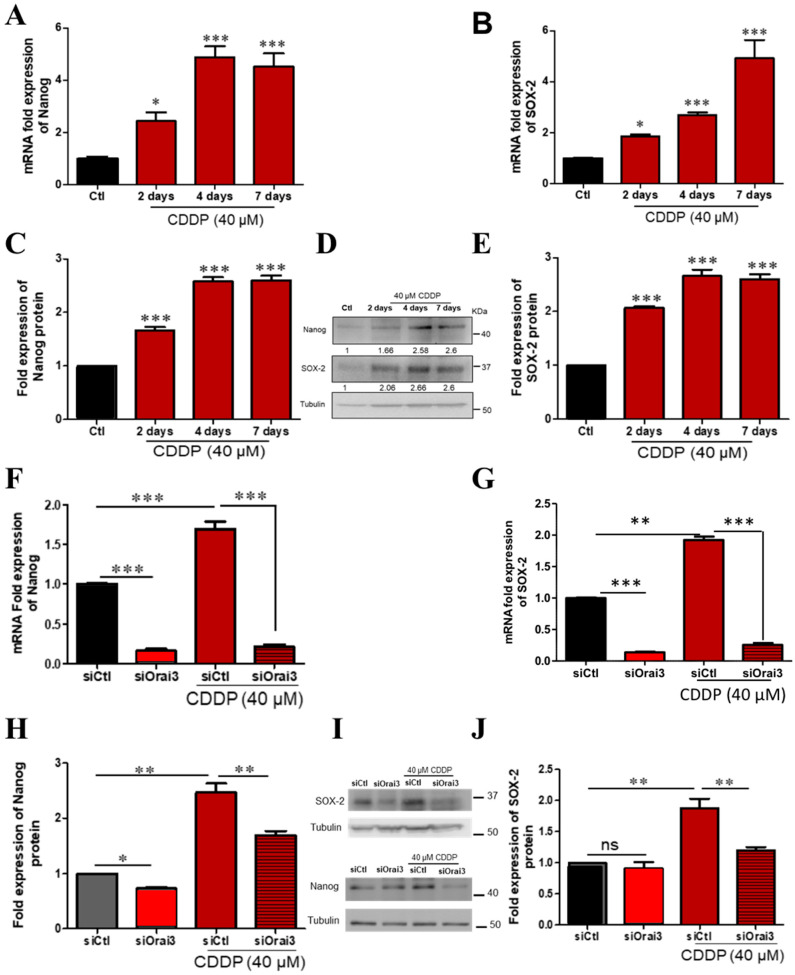
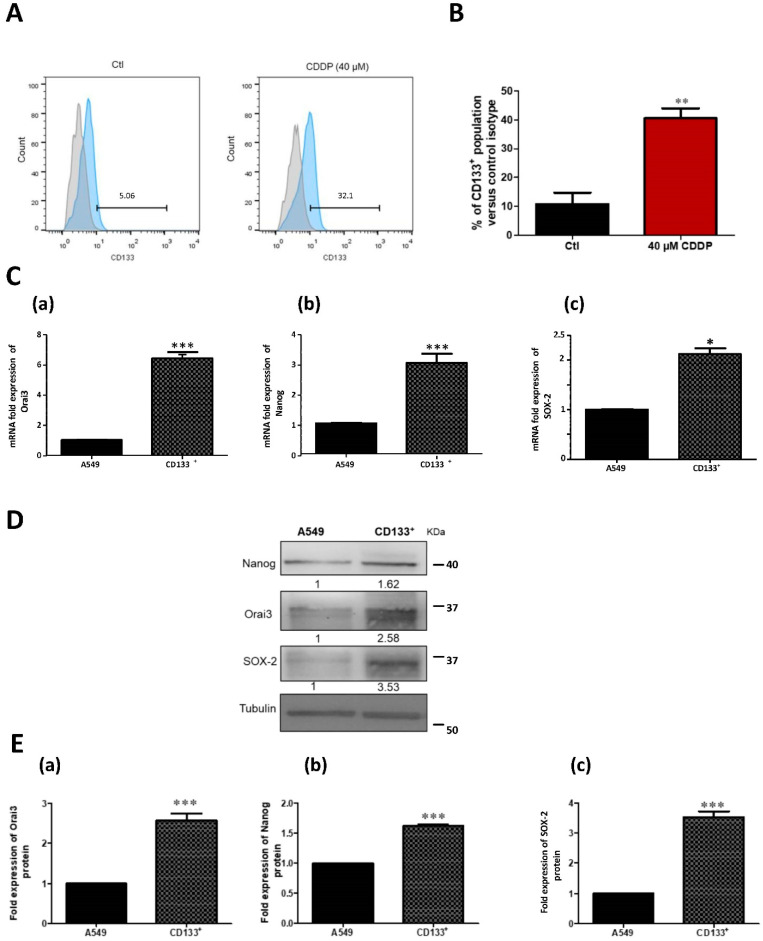
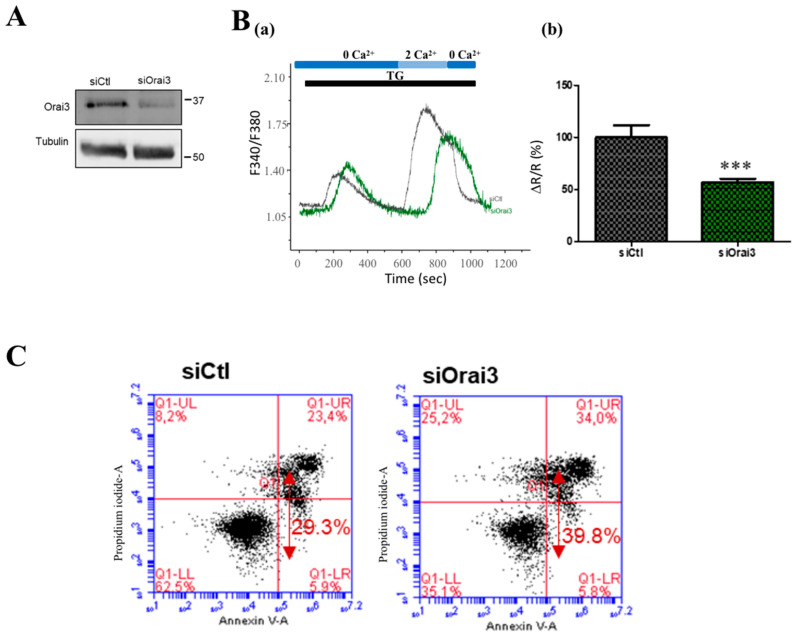
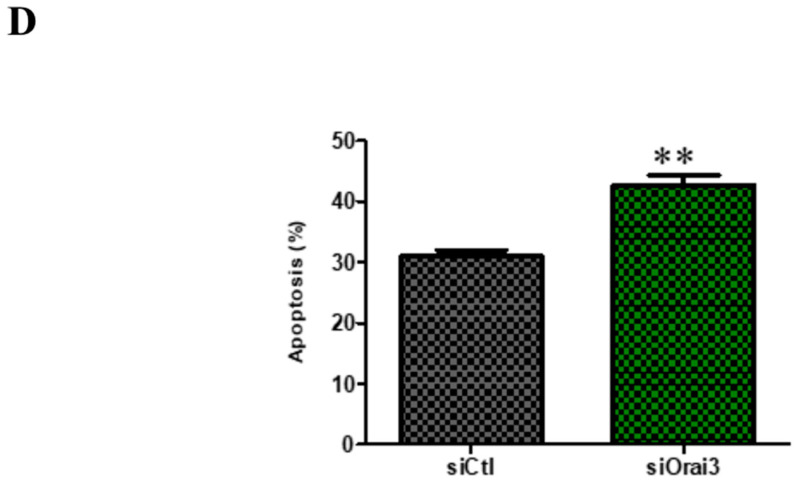
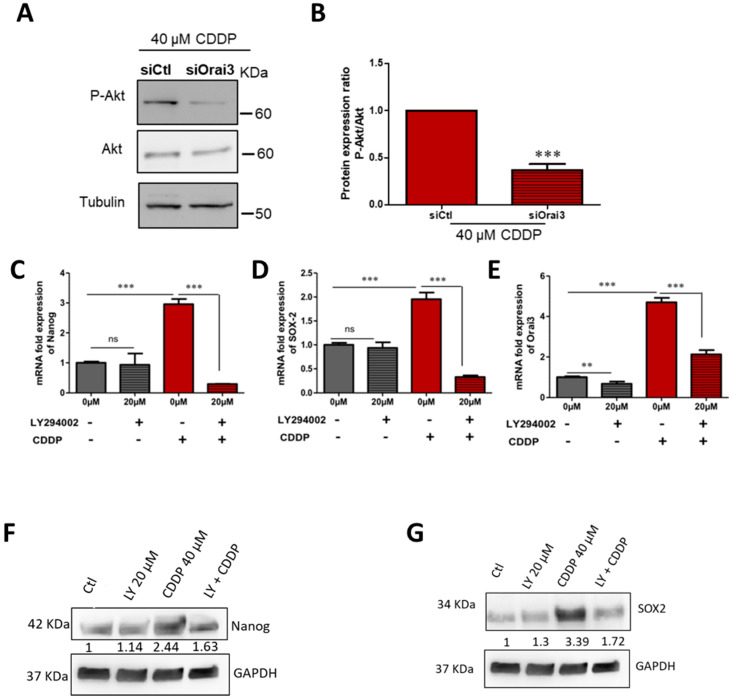
The development of the resistance to platinum salts is a major obstacle in the treatment of non-small cell lung cancer (NSCLC). Among the reasons underlying this resistance is the enrichment of cancer stem cells (CSCs) populations. Several studies have reported the involvement of calcium channels in chemoresistance. The Orai3 channel is overexpressed and constitutes a predictive marker of metastasis in NSCLC tumors. Here, we investigated its role in CSCs populations induced by Cisplatin (CDDP) in two NSCLC cell lines. We found that CDDP treatment increased Orai3 expression, but not Orai1 or STIM1 expression, as well as an enhancement of CSCs markers. Moreover, Orai3 silencing or the reduction of extracellular calcium concentration sensitized the cells to CDDP and led to a reduction in the expression of Nanog and SOX-2. Orai3 contributed to SOCE (Store-operated Calcium entry) in both CDDP-treated and CD133+ subpopulation cells that overexpress Nanog and SOX-2. Interestingly, the ectopic overexpression of Orai3, in the two NSCLC cell lines, lead to an increase of SOCE and expression of CSCs markers. Furthermore, CD133+ cells were unable to overexpress neither Nanog nor SOX-2 when incubated with PI3K inhibitor. Finally, Orai3 silencing reduced Akt phosphorylation. Our work reveals a link between Orai3, CSCs and resistance to CDDP in NSCLC cells.

Keywords: Cisplatin; Orai3; cancer stem cell markers; chemoresistance; non-small cell lung carcinoma; store-operated calcium entry.


Conflict of interest statement

The authors declare no conflict of interest.

Figures

Figure 1
Figure 1
Immunohistochemical staining of Orai1 and Orai3 of bronchial biopsies before and after chemotherapy. (a) Representative examples of Orai1 and Orai3 (b) expressions of original magnification: × 200. Inserts show negative controls obtained by omitting the primary antibodies. All pictures show a low magnification image of negative controls in the lower right corner. Analysis of H-score of Orai1 and Orai3 of bronchial biopsies before and after chemotherapy (c). Values are presented as mean of results obtained from 15 patients ± SEM, * p < 0.05, Mann–Whitney U test.
Figure 2
Figure 2
Orai3 silencing increases the sensitivity to CDDP treatment in A549 and H23 cells. (A) Orai3 and Orai1 expression in A549 compared to H23 cell line. Expression at the mRNA level of Orai3 (A-a) and Orai1 (A-b) normalized to GAPDH. Western blot showing protein expression of Orai3 (A-c) and Orai1 (A-d) with their respective quantifications (A-e) and (A-f). Values presented are the mean of three independent experiments ± SEM. *** p < 0.001, ** p ˂ 0.01, * p ˂ 0.05, Student’s t-test. (B,C) Assessment of CDDP-induced apoptosis using flow cytometry Annexin V and PI staining in A549 (B-a) and H23 (C-a) cells. Quantification of the percentage of apoptosis in each condition in A549 (B-b) and H23 (C-b) cells. Values of three independent experiments are presented as mean ± SEM. *** p < 0.001 vs. control, ns: not significant. ANOVA followed by Holm–Sidak post test.
Figure 3
Figure 3
CDDP treatment increases the expression of Orai3 in both NSCLC cell lines. Orai3 gene expression following CDDP treatment in A549 cells (A-a). Western blot representing Orai3 protein expression (A-b) with its respective quantification normalized to Tubulin (A-c), ANOVA followed by Dunnett post-test ** p <0.01, * p < 0.05 of at least three independent experiments. Orai3 expression at mRNA level under CDDP treatment in H23 cells (B-a), ANOVA followed by Dunnett post-test *** p < 0.001 of three independent experiments. Western blot representing Orai3 protein expression (B-b) with its respective quantification normalized to Tubulin (B-c), ANOVA followed by Dunnett post-test ** p < 0.01, * p < 0.05, N = 3. (C,D) Orai1 mRNA quantification in A549 (C) and H23 (D) cells treated by CDDP. ANOVA followed by Dunnett post-test ** p < 0.01, N = 4.
Figure 4
Figure 4
Functional expression of Orai3 and Orai1 in H23 cell line. Traces representing the SOCE measured with the ratio F340/F380 using calcium imaging technique in H23 cells after Orai1 or Orai3 silencing in the presence of CDDP (A,E,F). Cells were exposed to 1 µM TG in the absence of extracellular Ca2+ which depletes the intracellular Ca2+ stores. Extracellular calcium concentration was then brought to 2 mM in order to induce SOCE (2APB was perfused in F). Quantification of SOCE (B), basal calcium (C) and TG-response (D). All histograms are represented as the average ± SEM normalized to the control. (AD; siCtl: n = 150, siOrai3: n = 70, siCtl + CDDP: n = 60, siOrai3 + CDDP: n = 34, N = 3), (E; siCtl: n = 116, siOrai1: n = 40, siCtl + CDDP: n = 34, siOrai1+ CDDP: n = 25, N = 3), (F, siCtl: n = 90, siCtl + CDDP: n = 30, siOrai3 + CDDP: n = 26, N = 3). Student’s t-test, * p < 0.05, *** p < 0.001, N.S. statically not significant, n: number of cells, N: number of passages.
Figure 5
Figure 5
Effect of Orai3 channel overexpression on apoptosis induced by Cisplatin in A549 cells. Transfection validation with VOrai3 via Western blot showing Orai3 protein expression (A-a). Effect of Orai3 overexpression on the calcium signal in A549 cells. SOCE was measured after endoplasmic reticulum release by 1µM TG (A-b). Quantification of SOCE by measuring the ratio of the peak amplitude over the initial (A-c). Student’s t-test, ** p < 0.01, Vempty: n = 53, VOrai3: n = 89, N = 3. Assessment of CDDP-induced apoptosis using flow cytometry Annexin V and PI staining in A549 cells transfected with Vempty and VOrai3 (B). Quantification of the percentage of apoptosis (C), ANOVA followed by Holm–Sidak post-test, *** p < 0.001 ** p < 0.01 * p < 0.05, N = 3.
Figure 6
Figure 6
CDDP induces expression of stem cell markers in A549 cells which was prevented upon Orai3 silencing. Relative mRNA expression of Nanog (A) and SOX-2 (B) after 2–7 days CDDP treatment with respect to GAPDH and relative protein expression (D) of Nanog (C) and SOX-2 (E) normalized to Tubulin, ANOVA followed by Dunnett post-test ** p < 0.01, *** p < 0.001, N = 3. Relative mRNA expression of Nanog (F) and SOX-2 (G) after Orai3 silencing and 48 h treatment with CDDP and the respective protein expression using Western blot (I) representing Nanog (H) and SOX-2 (J) protein expression normalized to Tubulin, ANOVA followed by Holm–Sidak post-test * p < 0.05,** p < 0.01, ***p <0.001. ns: not significant, N = 3.
Figure 7
Figure 7
CDDP treatment in A549 cells increased CD133+ cell population. Flow cytometry representative histogram showing that 40 µM Cisplatin treatment for 48 h increased CD133 expression with respect to control (A) and its respective quantification (B). Bars represent percentage values of CD133+ population of each condition relative to isotype. Student’s t-test, ** p < 0.01, N = 3. The expression of Orai3 and stemness markers in sorted CDDP-induced CD133+ cells vs. parental A549 cells. Relative mRNA expression of Orai3 (C-a), Nanog (C-b) and SOX-2 (C-c). Western blot representing Orai3, SOX-2 and Nanog protein expression (D) with the respective quantifications (E-a, E-b and E-c). Student’s t-test, * p < 0.05, *** p < 0.001, N = 3.
Figure 8
Figure 8
Function of Orai3 channel in CDDP-induced CD133+ A549 cells in calcium entry and apoptosis. Transfection validation: protein expression of Orai3 in CD133+ cells transfected with siCtl and siOrai3 (A). Traces representing the SOC entry measured with the ratio F340/F380 using calcium imaging technique (B-a). Cells were exposed to 1 µM TG in the absence of extracellular Ca2+ which depletes the intracellular Ca2+ stores. Extracellular calcium concentration was then brought to 2 mM in order to induce SOCE. Quantification of the SOCE by measuring the ratio of the peak amplitude over the initial (B-b). (siCtl: n = 60, siOrai3: n = 52, N = 3, *** p < 0.001, Student’s t-test, n: number of cells, N: number of passage). Flow cytometric analysis of early, late apoptosis and necrosis in CD133+ cells transfected with siCtl or siOrai3 (C). Bar chart represents the percentage of total apoptosis in each condition in CD133+ cells (D). Student’s t-test, *** p < 0.001 ** p < 0.01, N = 3.
Figure 8
Figure 8
Function of Orai3 channel in CDDP-induced CD133+ A549 cells in calcium entry and apoptosis. Transfection validation: protein expression of Orai3 in CD133+ cells transfected with siCtl and siOrai3 (A). Traces representing the SOC entry measured with the ratio F340/F380 using calcium imaging technique (B-a). Cells were exposed to 1 µM TG in the absence of extracellular Ca2+ which depletes the intracellular Ca2+ stores. Extracellular calcium concentration was then brought to 2 mM in order to induce SOCE. Quantification of the SOCE by measuring the ratio of the peak amplitude over the initial (B-b). (siCtl: n = 60, siOrai3: n = 52, N = 3, *** p < 0.001, Student’s t-test, n: number of cells, N: number of passage). Flow cytometric analysis of early, late apoptosis and necrosis in CD133+ cells transfected with siCtl or siOrai3 (C). Bar chart represents the percentage of total apoptosis in each condition in CD133+ cells (D). Student’s t-test, *** p < 0.001 ** p < 0.01, N = 3.
Figure 9
Figure 9
Regulation of Orai3 and stemness markers expression in CD133+ A549 cells induced by CDDP by PI3K pathway. Representative Western blotting of P-Akt and Akt proteins in A549 cells transfected with si-Orai3 or siCtl in the presence of CDDP (A) and respective protein expression (B). Data are presented as mean of three independent experiments ± SEM, Student’s t-test, *** p < 0.001. Relative mRNA expression with respect to GAPDH of Nanog (C), SOX-2 (D), and Orai3 (E) in CD133+ cells after 48 h CDDP treatment in the absence and presence of 20 μM LY294002 inhibitor. Relative protein expression of Nanog (F) and SOX-2 (G). Data are presented as mean of three independent experiments ± SEM, ANOVA followed by Holm–Sidak post-test ** p < 0.01 ***; p < 0.001, ns: not significant.

References

    1. Bray F., Ferlay J., Soerjomataram I., Siegel R.L., Torre L.A., Jemal A. Global Cancer Statistics 2018: GLOBOCAN Estimates of Incidence and Mortality Worldwide for 36 Cancers in 185 Countries. CA Cancer J. Clin. 2018;68:394–424. doi: 10.3322/caac.21492. - DOI - PubMed
    1. Noone A.-M., Cronin K.A., Altekruse S.F., Howlader N., Lewis D.R., Petkov V.I., Penberthy L. Cancer Incidence and Survival Trends by Subtype Using Data from the Surveillance Epidemiology and End Results Program, 1992–2013. Cancer Epidemiol. Biomark. Prev. 2017;26:632–641. doi: 10.1158/1055-9965.EPI-16-0520. - DOI - PMC - PubMed
    1. Mizushima Y., Kobayashi M. Clinical Characteristics of Synchronous Multiple Lung Cancer Associated with Idiopathic Pulmonary Fibrosis. Chest. 1995;108:1272–1277. doi: 10.1378/chest.108.5.1272. - DOI - PubMed
    1. Hanna N., Johnson D., Temin S., Baker S., Brahmer J., Ellis P.M., Giaccone G., Hesketh P.J., Jaiyesimi I., Leighl N.B., et al. Systemic Therapy for Stage IV Non-Small-Cell Lung Cancer: American Society of Clinical Oncology Clinical Practice Guideline Update. J. Clin. Oncol. Off. J. Am. Soc. Clin. Oncol. 2017;35:3484–3515. doi: 10.1200/JCO.2017.74.6065. - DOI - PubMed
    1. Lisberg A., Garon E.B. Does Platinum-Based Chemotherapy Still Have a Role in First-Line Treatment of Advanced Non-Small-Cell Lung Cancer? J. Clin. Oncol. 2019;37:529–536. doi: 10.1200/JCO.18.01534. - DOI - PubMed