Syndecan-1 Promotes Angiogenesis in Triple-Negative Breast Cancer through the Prognostically Relevant Tissue Factor Pathway and Additional Angiogenic Routes
- PMID: 34066023
- PMCID: PMC8150756
- DOI: 10.3390/cancers13102318
Syndecan-1 Promotes Angiogenesis in Triple-Negative Breast Cancer through the Prognostically Relevant Tissue Factor Pathway and Additional Angiogenic Routes
Abstract
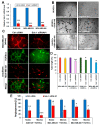
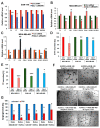
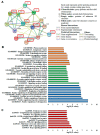
Triple-negative breast cancer (TNBC) is characterized by increased angiogenesis, metastasis, and poor survival. Dysregulation of the cell surface heparan sulfate proteoglycan and signaling co-receptor Syndecan-1 is linked to poor prognosis. To study its role in angiogenesis, we silenced Syndecan-1 in TNBC cell lines using a 3D human umbilical vein endothelial cell (HUVEC) co-culture system. Syndecan-1 siRNA depletion in SUM-149, MDA-MB-468, and MDA-MB-231 cells decreased HUVEC tubule network formation. Angiogenesis array revealed reduced VEGF-A and tissue factor (TF) in the Syndecan-1-silenced secretome. qPCR independently confirmed altered expression of F3, F7, F2R/PAR1, F2RL1/PAR2, VEGF-A, EDN1, IGFBP1, and IGFBP2 in SUM-149, MDA-MB-231, and MDA-MB-468 cells. ELISA revealed reduced secreted endothelin-1 (SUM-149, MDA-MB-468) and TF (all cell lines) upon Syndecan-1 depletion, while TF pathway inhibitor treatment impaired angiogenesis. Survival analysis of 3951 patients demonstrated that high expression of F3 and F7 are associated with better relapse-free survival, whereas poor survival was observed in TNBC and p53 mutant basal breast cancer (F3) and in ER-negative and HER2-positive breast cancer (F2R, F2RL1). STRING protein network analysis revealed associations of Syndecan-1 with VEGF-A and IGFBP1, further associated with the TF and ET-1 pathways. Our study suggests that TNBC Syndecan-1 regulates angiogenesis via the TF and additional angiogenic pathways and marks its constituents as novel prognostic markers and therapeutic targets.
Keywords: 3D co-culture; CD138; PAR1; PAR2; Syndecan-1; angiogenesis; endothelin-1; prognosis; tissue factor; triple-negative breast cancer.
Conflict of interest statement
The authors declare no competing interests.
Figures


Similar articles
-
Role of syndecan-4 in angiogenesis and vasculogenic mimicry in triple negative breast cancer cells.Matrix Biol. 2025 Apr;136:127-133. doi: 10.1016/j.matbio.2025.02.002. Epub 2025 Feb 10. Matrix Biol. 2025. PMID: 39938698
-
Syndecan-1 (CD138) modulates triple-negative breast cancer stem cell properties via regulation of LRP-6 and IL-6-mediated STAT3 signaling.PLoS One. 2013 Dec 31;8(12):e85737. doi: 10.1371/journal.pone.0085737. eCollection 2013. PLoS One. 2013. PMID: 24392029 Free PMC article.
-
The Heparan Sulfate Proteoglycan Syndecan-1 Triggers Breast Cancer Cell-Induced Coagulability by Induced Expression of Tissue Factor.Cells. 2023 Mar 16;12(6):910. doi: 10.3390/cells12060910. Cells. 2023. PMID: 36980251 Free PMC article.
-
An expression signature of syndecan-1 (CD138), E-cadherin and c-met is associated with factors of angiogenesis and lymphangiogenesis in ductal breast carcinoma in situ.Breast Cancer Res. 2007;9(1):R8. doi: 10.1186/bcr1641. Breast Cancer Res. 2007. PMID: 17244359 Free PMC article.
-
Syndecan-1 (CD138) as a Pathogenesis Factor and Therapeutic Target in Breast Cancer.Curr Med Chem. 2021;28(25):5066-5083. doi: 10.2174/0929867328666210629122238. Curr Med Chem. 2021. PMID: 34191695 Review.
Cited by
-
A molecular approach to triple-negative breast cancer: targeting the Notch signaling pathway.Einstein (Sao Paulo). 2024 Feb 5;22:eRW0552. doi: 10.31744/einstein_journal/2024RW0552. eCollection 2024. Einstein (Sao Paulo). 2024. PMID: 38324848 Free PMC article. Review.
-
SDC1 is a critical transmembrane proteoglycan in breast cancer.World J Surg Oncol. 2025 May 16;23(1):193. doi: 10.1186/s12957-025-03840-z. World J Surg Oncol. 2025. PMID: 40380211 Free PMC article. Review.
-
Differential Impact of Membrane-Bound and Soluble Forms of the Prognostic Marker Syndecan-1 on the Invasiveness, Migration, Apoptosis, and Proliferation of Cervical Cancer Cells.Front Oncol. 2022 Jan 27;12:803899. doi: 10.3389/fonc.2022.803899. eCollection 2022. Front Oncol. 2022. PMID: 35155241 Free PMC article.
-
The Tissue Factor Pathway in Cancer: Overview and Role of Heparan Sulfate Proteoglycans.Cancers (Basel). 2023 Feb 28;15(5):1524. doi: 10.3390/cancers15051524. Cancers (Basel). 2023. PMID: 36900315 Free PMC article. Review.
-
Targeting syndecan-1: new opportunities in cancer therapy.Am J Physiol Cell Physiol. 2022 Jul 1;323(1):C29-C45. doi: 10.1152/ajpcell.00024.2022. Epub 2022 May 18. Am J Physiol Cell Physiol. 2022. PMID: 35584326 Free PMC article. Review.
References
Grants and funding
LinkOut - more resources
Full Text Sources
Research Materials
Miscellaneous

