Review
. 2021 May 12;21(10):3360.
doi: 10.3390/s21103360.

Determination of Folic Acid Using Biosensors-A Short Review of Recent Progress

Affiliations
Review

Determination of Folic Acid Using Biosensors-A Short Review of Recent Progress

Alessio Di Tinno et al. Sensors (Basel). .

Abstract

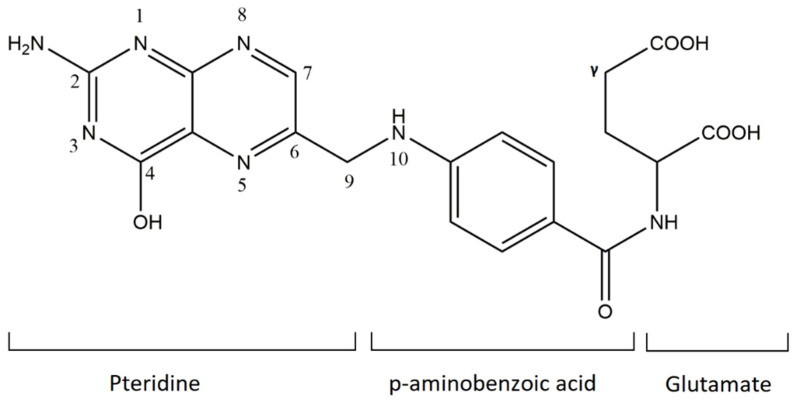
Folic acid (FA) is the synthetic surrogate of the essential B vitamin folate, alternatively named folacin, pteroylglutamic acid or vitamin B9. FA is an electroactive compound that helps our body to create and keep our cells healthy: it acts as the main character in a variety of synthetic biological reactions such as the synthesis of purines, pyrimidine (thus being indirectly implied in DNA synthesis), fixing and methylation of DNA. Therefore, physiological folate deficiency may be responsible for severe degenerative conditions, including neural tube defects in developing embryos and megaloblastic anaemia at any age. Moreover, being a water-soluble molecule, it is constantly lost and has to be reintegrated daily; for this reason, FA supplements and food fortification are, nowadays, extremely diffused and well-established practices. Consequently, accurate, reliable and precise analytical techniques are needed to exactly determine FA concentration in various media. Thus, the aim of this review is to report on research papers of the past 5 years (2016-2020) dealing with rapid and low-cost electrochemical determination of FA in food or biological fluid samples.

Keywords: analytical methods; electrochemical tools; folic acid; real samples.


Conflict of interest statement

The authors declare no conflict of interest.

Figures

Figure 1
Figure 1
Schematic representation of folic acid (mono-glutamate derivate).
Figure 2
Figure 2
SWVs of 2FTNEMCNPPE in 0.1 M PBS (pH 7.0) with various concentrations (μmol L−1) of EP, UA FA in a mixed solution: (1) 5.0 + 5.0 + 10.0, (2) 50.0 + 25.0 + 10.0, (3) 150.0 + 100.0 + 20.0, (4) 400.0 + 300.0 + 40.0, (5) 700.0 + 550.0 + 60.0. (AC): plots of peak currents as a function of EP, UA and FA concentration, respectively [50].
Figure 3
Figure 3
SWVs obtained for various concentrations of UA (5 to 500 μM) (A) and FA (1 to 800 μM) (B) at Mn SnO2/GCE in the presence of 200 μM AA in 0.1 M PBS (pH 6.0) and inreal samples (C). (insert of AC): plots of the oxidation peak currents as a function of various concentrations of UA and FA, respectively [51].
Figure 4
Figure 4
Current-concentration curve for the oxidation of FA in the range of 3.0 nM–250 µM. Inset: relative DP voltammograms of FA at surface of PE/CuO-CNTs/BDHFP [52].
Figure 5
Figure 5
(A): Differential pulse voltammograms of CPE in 0.1 M PB (pH = 8.0) and drug tablet (3.0 µM FA) containing different concentrations of pure FA: a–e corresponds to 0.0–4.0 µM of pure FA. (B): Differential pulse voltammograms of CPE in 0.1 M PB (pH = 8.0) and 0.2 mL of a urine sample containing a different concentration of FA: the letters a–d correspond to 0.0–9.0 µM of FA. (C,D): Standard addition curve of the peak current density J (µM cm−2) (extrapolated from respectively voltammograms A and B) vs. the concentration of FA [53].
Figure 6
Figure 6
(A): Nyquist diagrams of (a) CPE, (b) FeNi3/rGO/CPE, (c) HMPF6/CPE and (d) FeNi3/rGO/HMPF6/CPE in 1.0 mM [Fe(CN)6]3−,4−. (B): SW voltammograms of solution containing TBHQ and FA at the FeNi3/rGO/HMPF6/CPE; (a) 35.0 + 50.0; (b) 45.0 + 70.0; (c) 60.0 + 80.0; (d) 70.0 + 100.0; (e) 90.0 + 140.0; (f) 110.0 + 170.0; (g) 135.0 + 200.0 and (h) 165.0 + 240.0 μM. (C): The Ipa vs. TBHQ concentration obtained from SW voltammograms. (D): The Ipa vs. folic acid concentration obtained from SW voltammograms [54].
Figure 7
Figure 7
(A): Scheme of the electrochemical oxidation of FA on GONR/SPE. (B): EIS curves of unmodified SPE (a) MOS2-SPE (b), GNS-MoS2 /SPE (c), MoS2-AuNPs/SPE, (d) in 0.1 M KCl containing 5 mM Fe(CN)6 3−/4−. Frequency: 0.1 Hz to 100 kHz [63].
Figure 8
Figure 8
(A): SEM Micrograph of NiFe2O4 and its EDX. (B): deposition of NPs on SPE with drop casting. (C): CVs of NFO/SPE in 0.1 M PBS (pH 7) containing 150 µM of FA at various scan rates; numbers 1–12 correspond to 10, 25, 50, 75, 100, 200, 300, 400, 500, 600, 700 and 800 mV s−1, respectively. Inset: variation of anodic peak current vs. square root of scan rate [64].

Similar articles

Cited by

References

    1. Andlid T.A., D’Aimmo M.R., Jastrebova J. the Bifidobacteria and Related Organisms. Elsevier; Amsterdam, The Netherlands: 2018. Folate and bifidobacteria; pp. 195–212.
    1. Langston W.C., Darby W.J., Shukers C.F., Day P.L. Nutritional Cytopenia (Vitamin M Deficiency) in the Monkey. J. Exp. Med. 1938;68:923–940. doi: 10.1084/jem.68.6.923. - DOI - PMC - PubMed
    1. Talwar G.P. Textbook of Biochemistry, Biotechnology, Allied and Molecular Medicine. 4th ed. Prentice-Hall of India; New Delhi, India: 2015. Place of Publication Not Identified.
    1. Bandžuchová L., Šelešovská R., Navrátil T., Chýlková J. Electrochemical behavior of folic acid on mercury meniscus modified silver solid amalgam electrode. Electrochim. Acta. 2011;56:2411–2419. doi: 10.1016/j.electacta.2010.10.090. - DOI
    1. Akbar S., Anwar A., Kanwal Q. Electrochemical determination of folic acid: A short review. Anal. Biochem. 2016;510:98–105. doi: 10.1016/j.ab.2016.07.002. - DOI - PubMed