

Variability of Amyloid Propensity in Imperfect Repeats of CsgA Protein of Salmonella enterica and Escherichia coli
- PMID: 34066237
- PMCID: PMC8151669
- DOI: 10.3390/ijms22105127
Variability of Amyloid Propensity in Imperfect Repeats of CsgA Protein of Salmonella enterica and Escherichia coli
Abstract
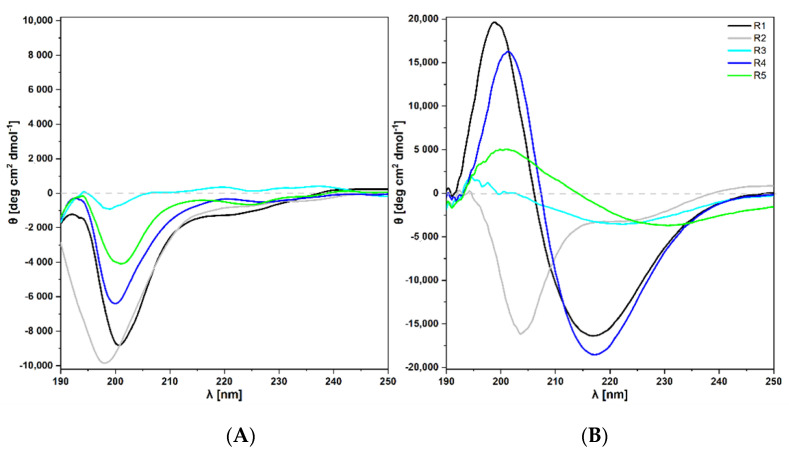
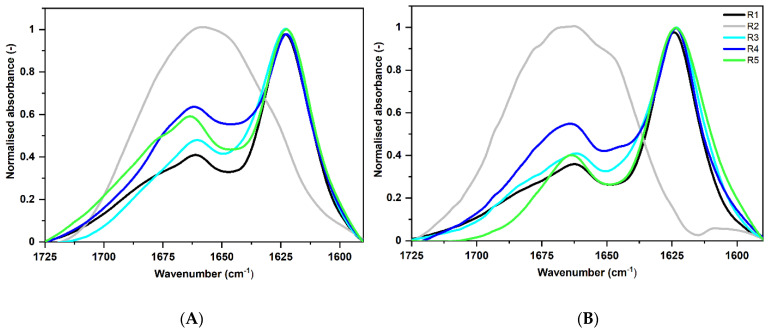
CsgA is an aggregating protein from bacterial biofilms, representing a class of functional amyloids. Its amyloid propensity is defined by five fragments (R1-R5) of the sequence, representing non-perfect repeats. Gate-keeper amino acid residues, specific to each fragment, define the fragment's propensity for self-aggregation and aggregating characteristics of the whole protein. We study the self-aggregation and secondary structures of the repeat fragments of Salmonella enterica and Escherichia coli and comparatively analyze their potential effects on these proteins in a bacterial biofilm. Using bioinformatics predictors, ATR-FTIR and FT-Raman spectroscopy techniques, circular dichroism, and transmission electron microscopy, we confirmed self-aggregation of R1, R3, R5 fragments, as previously reported for Escherichia coli, however, with different temporal characteristics for each species. We also observed aggregation propensities of R4 fragment of Salmonella enterica that is different than that of Escherichia coli. Our studies showed that amyloid structures of CsgA repeats are more easily formed and more durable in Salmonella enterica than those in Escherichia coli.
Keywords: ATR-FTIR; FT-Raman; aggregation; biofilm; curli; functional amyloids.
Conflict of interest statement
The authors declare no conflict of interest.
Figures


Similar articles
-
Gatekeeper residues in the major curlin subunit modulate bacterial amyloid fiber biogenesis.Proc Natl Acad Sci U S A. 2010 Jan 5;107(1):163-8. doi: 10.1073/pnas.0908714107. Epub 2009 Dec 4. Proc Natl Acad Sci U S A. 2010. PMID: 19966296 Free PMC article.
-
Structural effects of charge destabilization and amino acid substitutions in amyloid fragments of CsgA.Spectrochim Acta A Mol Biomol Spectrosc. 2024 May 15;313:124094. doi: 10.1016/j.saa.2024.124094. Epub 2024 Mar 6. Spectrochim Acta A Mol Biomol Spectrosc. 2024. PMID: 38503257
-
Curli-Mediated Self-Assembly of a Fibrous Protein Scaffold for Hydroxyapatite Mineralization.ACS Synth Biol. 2020 Dec 18;9(12):3334-3343. doi: 10.1021/acssynbio.0c00415. Epub 2020 Nov 25. ACS Synth Biol. 2020. PMID: 33237760
-
Curli provide the template for understanding controlled amyloid propagation.Prion. 2008 Apr-Jun;2(2):57-60. doi: 10.4161/pri.2.2.6746. Epub 2008 Apr 5. Prion. 2008. PMID: 19098444 Free PMC article. Review.
-
Functional Bacterial Amyloids: Understanding Fibrillation, Regulating Biofilm Fibril Formation and Organizing Surface Assemblies.Molecules. 2022 Jun 24;27(13):4080. doi: 10.3390/molecules27134080. Molecules. 2022. PMID: 35807329 Free PMC article. Review.
Cited by
-
Molecular characterization of the N-terminal half of TasA during amyloid-like assembly and its contribution to Bacillus subtilis biofilm formation.NPJ Biofilms Microbiomes. 2023 Sep 22;9(1):68. doi: 10.1038/s41522-023-00437-w. NPJ Biofilms Microbiomes. 2023. PMID: 37739955 Free PMC article.
-
PACT - Prediction of amyloid cross-interaction by threading.Sci Rep. 2023 Dec 14;13(1):22268. doi: 10.1038/s41598-023-48886-9. Sci Rep. 2023. PMID: 38097650 Free PMC article.
-
Harnessing deep learning for proteome-scale detection of amyloid signaling motifs.Bioinformatics. 2025 Jul 1;41(Supplement_1):i420-i428. doi: 10.1093/bioinformatics/btaf200. Bioinformatics. 2025. PMID: 40662825 Free PMC article.
-
Rapid serotype-independent differential detection of biofilm-positive and biofilm-negative Salmonella using Fourier transform infrared biotyping.One Health. 2025 Mar 6;20:101004. doi: 10.1016/j.onehlt.2025.101004. eCollection 2025 Jun. One Health. 2025. PMID: 40129480 Free PMC article.
-
Purification of the Bacterial Amyloid "Curli" from Salmonella enterica Serovar Typhimurium and Detection of Curli from Infected Host Tissues.Bio Protoc. 2022 May 20;12(10):e4419. doi: 10.21769/BioProtoc.4419. eCollection 2022 May 20. Bio Protoc. 2022. PMID: 35813019 Free PMC article.
References
-
- Schiebel J., Böhm A., Nitschke J., Burdukiewicz M., Weinreich J., Ali A., Roggenbuck D., Rödiger S., Schierack P. Genotypic and phenotypic characteristics associated with biofilm formation by human clinical Escherichia coli isolates of different pathotypes. Appl. Environ. Microbiol. 2017;83:1660–1677. doi: 10.1128/AEM.01660-17. - DOI - PMC - PubMed
MeSH terms
Substances
Grants and funding
LinkOut - more resources
Full Text Sources
Miscellaneous
