

In Vitro Synergistic Inhibition of HT-29 Proliferation and 2H-11 and HUVEC Tubulogenesis by Bacopaside I and II Is Associated with Ca2+ Flux and Loss of Plasma Membrane Integrity
- PMID: 34066415
- PMCID: PMC8148107
- DOI: 10.3390/ph14050436
In Vitro Synergistic Inhibition of HT-29 Proliferation and 2H-11 and HUVEC Tubulogenesis by Bacopaside I and II Is Associated with Ca2+ Flux and Loss of Plasma Membrane Integrity
Abstract
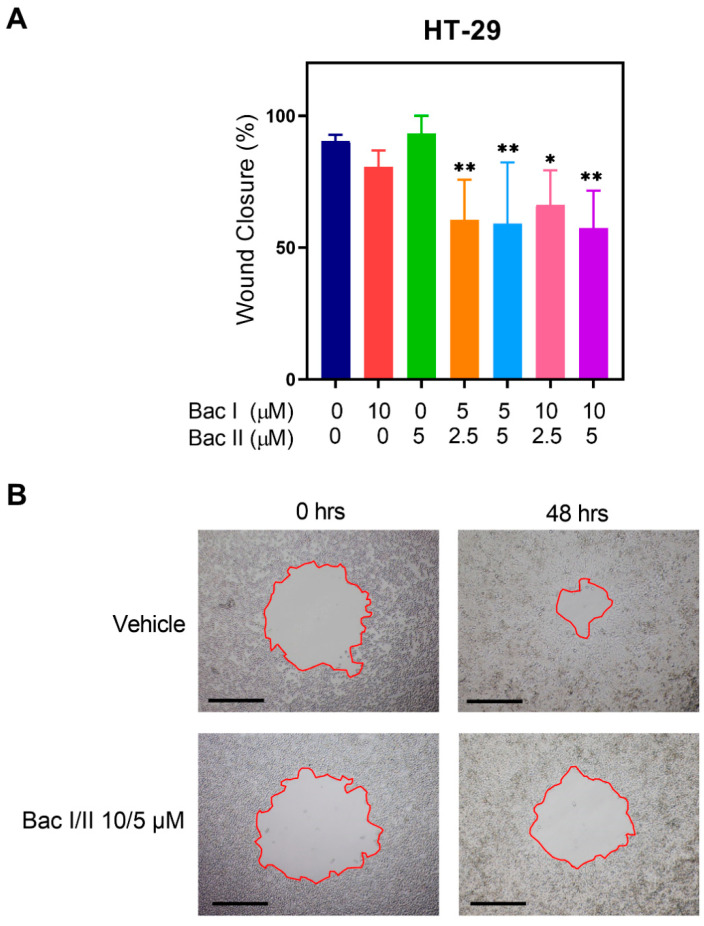
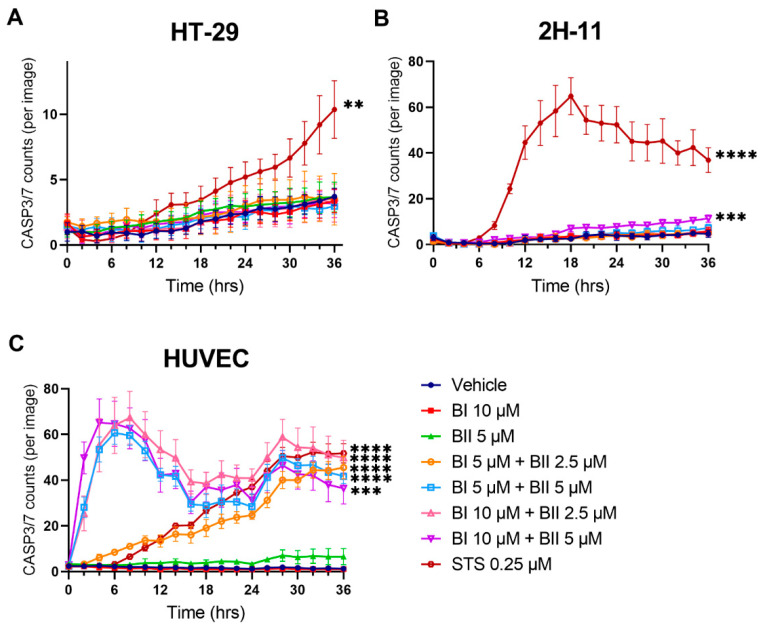
We previously showed how triterpene saponin bacopaside (bac) II, purified from the medicinal herb Bacopa monnieri, induced cell death in colorectal cancer cell lines and reduced endothelial cell migration and tube formation, and further demonstrated a synergistic effect of a combination of bac I and bac II on the inhibition of breast cancer cell line growth. Here, we assessed the effects of bac I and II on the colorectal cancer HT-29 cell line, and mouse (2H-11) and human umbilical vein endothelial cell (HUVEC) lines, measuring outcomes including cell viability, proliferation, migration, tube formation, apoptosis, cytosolic Ca2+ levels and plasma membrane integrity. Combined bac I and II, each applied at concentrations below IC50 values, caused a synergistic reduction of the viability and proliferation of HT-29 and endothelial cells, and impaired the migration of HT-29 and tube formation of endothelial cells. A significant enhancement of apoptosis was induced only in HUVEC, although an increase in cytosolic Ca2+ was detected in all three cell lines. Plasma membrane integrity was compromised in 2H-11 and HUVEC, as determined by an increase in propidium iodide staining, which was preceded by Ca2+ flux. These in vitro findings support further research into the mechanisms of action of the combined compounds for potential clinical use.
Keywords: Ca2+ flux; apoptosis; bacopaside I; bacopaside II; colorectal cancer cells; endothelial cells; migration; plasma membrane; proliferation; tube formation.
Conflict of interest statement
The authors declare no conflict of interest.
Figures


Similar articles
-
The Aquaporin 1 Inhibitor Bacopaside II Reduces Endothelial Cell Migration and Tubulogenesis and Induces Apoptosis.Int J Mol Sci. 2018 Feb 26;19(3):653. doi: 10.3390/ijms19030653. Int J Mol Sci. 2018. PMID: 29495367 Free PMC article.
-
Bacopasides I and II Act in Synergy to Inhibit the Growth, Migration and Invasion of Breast Cancer Cell Lines.Molecules. 2019 Sep 30;24(19):3539. doi: 10.3390/molecules24193539. Molecules. 2019. PMID: 31574930 Free PMC article.
-
The Purified Extract from the Medicinal Plant Bacopa monnieri, Bacopaside II, Inhibits Growth of Colon Cancer Cells In Vitro by Inducing Cell Cycle Arrest and Apoptosis.Cells. 2018 Jul 21;7(7):81. doi: 10.3390/cells7070081. Cells. 2018. PMID: 30037060 Free PMC article.
-
Protective effects of Bacopa monnieri on ischemia-induced cognitive deficits in mice: the possible contribution of bacopaside I and underlying mechanism.J Ethnopharmacol. 2015 Apr 22;164:37-45. doi: 10.1016/j.jep.2015.01.041. Epub 2015 Feb 7. J Ethnopharmacol. 2015. PMID: 25660331
-
Insights Into the Molecular Aspects of Neuroprotective Bacoside A and Bacopaside I.Curr Neuropharmacol. 2019;17(5):438-446. doi: 10.2174/1570159X16666180419123022. Curr Neuropharmacol. 2019. PMID: 29676230 Free PMC article. Review.
Cited by
-
Enhancement of Doxorubicin Efficacy by Bacopaside II in Triple-Negative Breast Cancer Cells.Biomolecules. 2025 Jan 3;15(1):55. doi: 10.3390/biom15010055. Biomolecules. 2025. PMID: 39858449 Free PMC article.
References
-
- Jain S.K. Ethnobotany and research on medicinal plants in India. Ciba Found. Symp. 1994;185:153–164. - PubMed
Grants and funding
LinkOut - more resources
Full Text Sources
Miscellaneous
