. 2021 May 6;22(9):4930.
doi: 10.3390/ijms22094930.

Mesenchymal Stem Cell-Derived Extracellular Vesicles Protect Human Corneal Endothelial Cells from Endoplasmic Reticulum Stress-Mediated Apoptosis

Affiliations

Mesenchymal Stem Cell-Derived Extracellular Vesicles Protect Human Corneal Endothelial Cells from Endoplasmic Reticulum Stress-Mediated Apoptosis

Lola Buono et al. Int J Mol Sci. .

Abstract

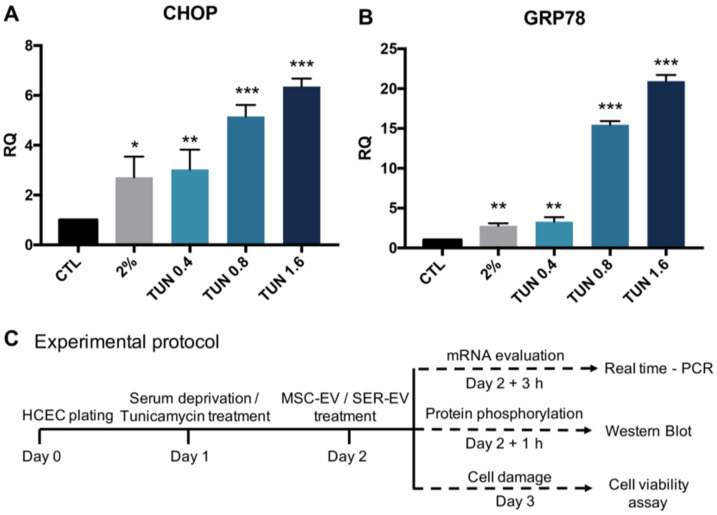
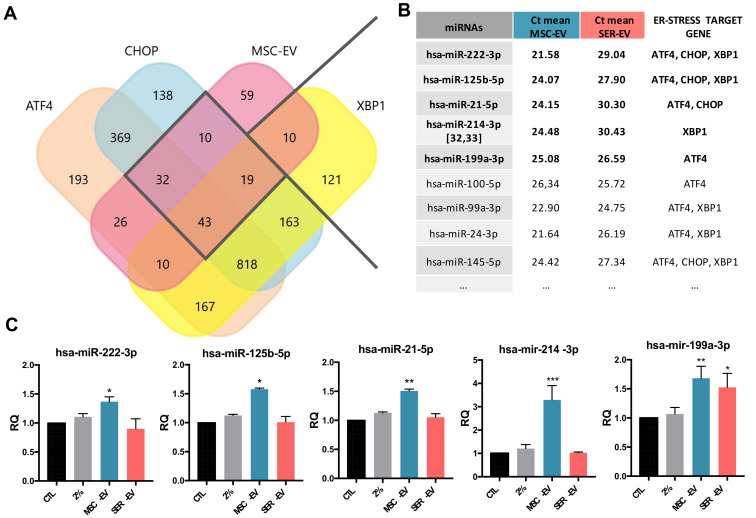
Corneal endothelial dystrophy is a relevant cause of vision loss and corneal transplantation worldwide. In the present study, we analyzed the effect of mesenchymal stem cell (MSC)-derived extracellular vesicles (MSC-EVs) in an in vitro model of corneal dystrophy, characterized by endoplasmic reticulum stress. The effects of MSC-EVs were compared with those of serum-derived EVs, reported to display a pro-angiogenic activity. MSC-EVs were able to induce a significant down-regulation of the large majority of endoplasmic reticulum stress-related genes in human corneal endothelial cells after exposure to serum deprivation and tunicamycin. In parallel, they upregulated the Akt pathway and limited caspase-3 activation and apoptosis. At variance, the effect of the serum EVs was mainly limited to Akt phosphorylation, with minimal or absent effects on endoplasmic reticulum stress modulation and apoptosis prevention. The effects of MSC-EVs were correlated to the transfer of numerous endoplasmic reticulum (ER)-stress targeting miRNAs to corneal endothelial cells. These data suggest a potential therapeutic effect of MSC-EVs for corneal endothelial endoplasmic reticulum stress, a major player in corneal endothelial dystrophy.

Keywords: corneal dystrophy; corneal endothelium; exosomes.


Conflict of interest statement

The authors declare no conflict of interest.

Figures

Figure 1
Figure 1
Isolation and characterization of human corneal endothelial cells. (A) Representative flow cytometry analysis of human corneal endothelial cells (HCECs) showing the negative staining of a control isotype (ISO PE) and the positive expression of CD166. (B) Representative immunofluorescence micrographs of HCECs stained with phalloidin (red), showing an elongated morphology. Blue = nuclear stain DAPI, original magnification: ×20. (C) Representative Western blot images of three HCEC independent cell lines positive for Na+K+ATPase and ZO-1. The renal HK2 cell line was used as a reference (Ctl). Actin was used as an endogenous loading reference.
Figure 2
Figure 2
Characterization of mesenchymal stem cell-derived extracellular vesicles (MSC-EVs) and blood serum-derived EVs (SER-EVs). (A) Representative nanoparticle tracking analysis showing the EV size distribution. (B) Super resolution microscopy micrographs showing the pattern distribution of CD63 in green, CD81 in red, and CD9 in blue for one MSC-EV and SER-EV. Scale bar: 50 nm. (C) Legend showing the 39 antibodies used in the assay and their respective colors in the dot plots. (D) MACSPlex representative dot plots showing the MSC-EV and SER-EV distribution of allophycocyanin (APC)-stained bead populations; captured EVs are counterstained with APC-labeled detection antibodies using a mixture of anti-CD9, anti-CD63, and anti-CD81 (pan tetraspanins) antibodies. (E) Representative quantification of the median APC fluorescence positive values for the bead populations after background correction, clustered in different graphs according to their classification: tetraspanins, immunological, mesenchymal, and endothelial markers.
Figure 3
Figure 3
(A) Tunicamycin and (B) serum deprivation both induce ER-stress. HCECs were treated with 2% Fetal bovine serum (FBS) (2%) and with increasing doses of tunicamycin (TUN 0.4–1.6 ng/mL) for 24 h. The mRNA levels of C/EBP homologous protein (CHOP) and GRP78 significantly increased in all of the damage conditions, when compared with the untreated cells (CTL). Glyceraldehyde 3-phosphate dehydrogenase (GAPDH) was used as an endogenous normalizer. Data were further normalized to CTL, set as 1, and used as a reference sample for each experiment. The graphs show the RQ average (2ΔΔCt) of at least three independent experiments ± standard deviation (SD). One-way analysis of variance (ANOVA) with Tukey’s multiple comparisons test was performed after the normalization of each experiment to CTL; * p < 0.05, ** p < 0.01, and *** p < 0.0001 with respect to CTL. (C) Experimental protocol used in the different experiments involving MSC- and SEV-EV treatments.
Figure 4
Figure 4
Regulation of the expression of ER stress related genes. HCECs were exposed to serum starvation or tunicamycin for 24 h, and were further stimulated with MSC- or SER-EVs for 3 h. Real time analysis showing the expression of ATF4, GRP78, XBP1, and CHOP with HCECs in normal culture conditions (CTL), in serum deprivation (2%) (A), or treated with 0.4 ng/mL of tunicamycin (TUN 0.4) (B), with or without 10–20 × 103 MSC-EV/cell (10K/20K MSC-EV) or 10–20 × 103 SER-EV/cell (10K/20K SER-EV). GAPDH was used as an endogenous normalizer. Data were further normalized to CTL, set as 1, and used as a reference sample for each experiment. The graphs show the RQ average (2ΔΔCt) of at least three independent experiments ± SD. One-way ANOVA with Tukey’s multiple comparisons test was performed after the normalization of each experiment to CTL; * p < 0.05, ** p < 0.01, and *** p < 0.0001 with respect to CTL, $ p < 0.05, $$ p < 0.01 vs. 2% (A) or TUN (B).
Figure 5
Figure 5
Western blot analysis on HCECs of ER stress related protein phosphorylation. HCECs were exposed to serum starvation for 24 h and further stimulated for 1 h with MSC- or SER-EVs. (A,B) Representative images of Western blot on HCECs in normal conditions (CTL), in serum deprivation (2%), and in serum deprivation in the presence of 10 × 103 MSC-EV/cell (2% MSC-EV) or in the presence of 10 × 103 SER-EV/cell (2% SER-EV). (A) Protein levels and the quantification of phospho-EIF2a normalized to total EIF2a and vinculin (VINC). (B) The protein levels and the quantification of p-AKT normalized to total Akt and vinculin (VINC) and to CTL. CTL, set as 1, was used as a reference sample for each experiment. The graphs show the average of at least three independent experiments ± SD. One-way ANOVA with Tukey’s multiple comparisons test was performed after the normalization of each experiment to CTL; * p < 0.05 vs. CTL, ** p <0.001 vs. CTL, $ p < 0.05 vs. 2%.
Figure 6
Figure 6
Apoptosis regulation HCECs after serum deprivation and EV treatment. HCECs were exposed to serum starvation for 24 h and further stimulated with MSC- or SER-EVs for 24 h. (A) Percentage of total apoptotic HCECs cultured either in normal conditions (CTL) or in serum deprivation for 24 h (2%), and treated for further 24 h with MSC-EVs or SER-EVs (20 × 103 EV/cell). (B) Percentage of total live HCECs cultured either in normal conditions (CTL) or in serum deprivation for 24 h (2%), and treated for a further 24 h with MSC-EVs or SER-EVs (20 × 103 EV/cell). (C) Protein levels of caspase-3 (CASP-3) and its quantification normalized to total vinculin (VINC). Vinculin was used as the endogenous control. CTL, set as 1, was used as the reference sample for each experiment. The graphs show the average of at least three independent experiments ± SD. One-way ANOVA with Tukey’s multiple comparisons test was performed after the normalization of each experiment to CTL. * p < 0.05 vs. CTL, ** p <0.001 vs. CTL, $ p < 0.05 vs. 2%, $$ p < 0.001 vs. 2%. (D) Representative image of Western blots on HCECs blotted with caspase-3 and the endogenous control vinculin.
Figure 7
Figure 7
Target miRNAs prediction of MSC-EVs and ER stress related genes. (A) Representative Venn diagram showing the numbers of the target miRNAs predicted for CHOP, ATF4, and XBP1, and those described in the literature for MSC-EVs [30]. The numbers displayed in the diagram represent the number of miRNAs that were found to target the indicated transcripts. (B) Table showing the miRNAs and Ct means of the most expressed miRNAs in MSC-EVs [29], compared with the Ct values of the same miRNAs in the SER-EVs [31]. Data are displayed as the mean CT value. The ER stress target gene column highlights the target genes of each miRNA among the genes used (ATF4, CHOP, and XBP1). (C) Real time PCR analysis of miRNAs transferred by MSC-EVs in HCECs. HCECs were treated with EVs in the presence of amanitin (50 μg/mL). CTL—HCECs in normal medium; 2%—HCECs in serum deprivation; MSC-EVs and SER-EVs—HCECs treated with MSC-EVs and SER-EVs (20 × 103 EV/cell), respectively. RNU6B was used as the endogenous normalizer. Data were further normalized to CTL, set as 1, and used as reference sample for each experiment. The graphs show the RQ average (2ΔΔCt) of at least three independent experiments ± SD. One-way ANOVA with Tukey’s multiple comparisons test was performed after the normalization of each experiment to CTL; * p < 0.05 vs. CTL, ** p < 0.001 vs. CTL, *** p < 0.0001 vs. CTL.

Similar articles

Cited by

References

    1. Okumura N., Hirano H., Numata R., Nakahara M., Ueno M., Hamuro J., Kinoshita S., Koizumi N. Cell surface markers of functional phenotypic corneal endothelial cells. Investig. Ophthalmol. Vis. Sci. 2014;55:7610–7618. doi: 10.1167/iovs.14-14980. - DOI - PubMed
    1. Matthaei M., Hribek A., Clahsen T., Bachmann B., Cursiefen C., Jun A.S. Fuchs Endothelial Corneal Dystrophy: Clinical, Genetic, Pathophysiologic, and Therapeutic Aspects. Annu. Rev. Vis. Sci. 2019;5:151–175. doi: 10.1146/annurev-vision-091718-014852. - DOI - PubMed
    1. Nanda G.G., Alone D.P. Review: Current understanding of the pathogenesis of fuchs’ endothelial corneal dystrophy. Mol. Vis. 2019;25:295–310. - PMC - PubMed
    1. Feizi S. Corneal endothelial cell dysfunction: Etiologies and management. Ther. Adv. Ophthalmol. 2018;9:1–19. doi: 10.1177/2515841418815802. - DOI - PMC - PubMed
    1. Okumura N., Kitahara M., Okuda H., Hashimoto K., Ueda E., Nakahara M., Kinoshita S., Young R.D., Quantock A.J., Tourtas T., et al. Sustained activation of the unfolded protein response induces cell death in Fuchs’ endothelial corneal dystrophy. Investig. Ophthalmol. Vis. Sci. 2017;58:3697–3707. doi: 10.1167/iovs.16-21023. - DOI - PubMed

MeSH terms