. 2021 May 6;22(9):4929.
doi: 10.3390/ijms22094929.

Spontaneous Cell Detachment and Reattachment in Cancer Cell Lines: An In Vitro Model of Metastasis and Malignancy

Affiliations

Spontaneous Cell Detachment and Reattachment in Cancer Cell Lines: An In Vitro Model of Metastasis and Malignancy

Elena Vargas-Accarino et al. Int J Mol Sci. .

Abstract

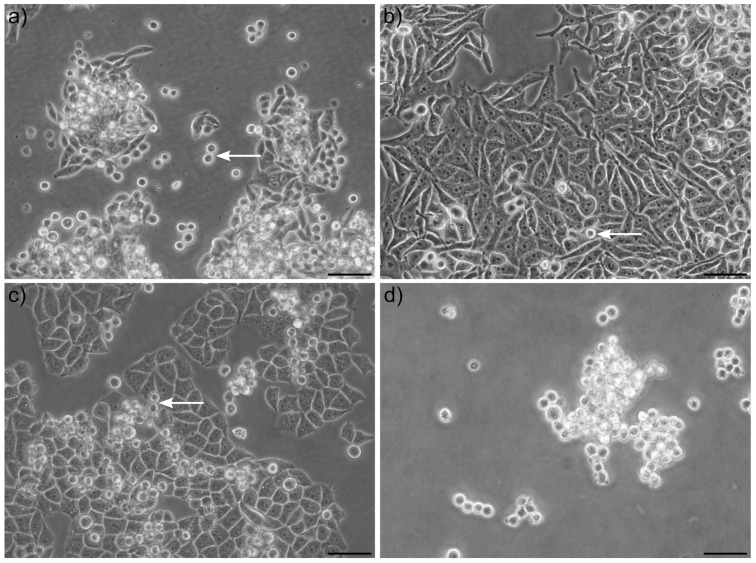
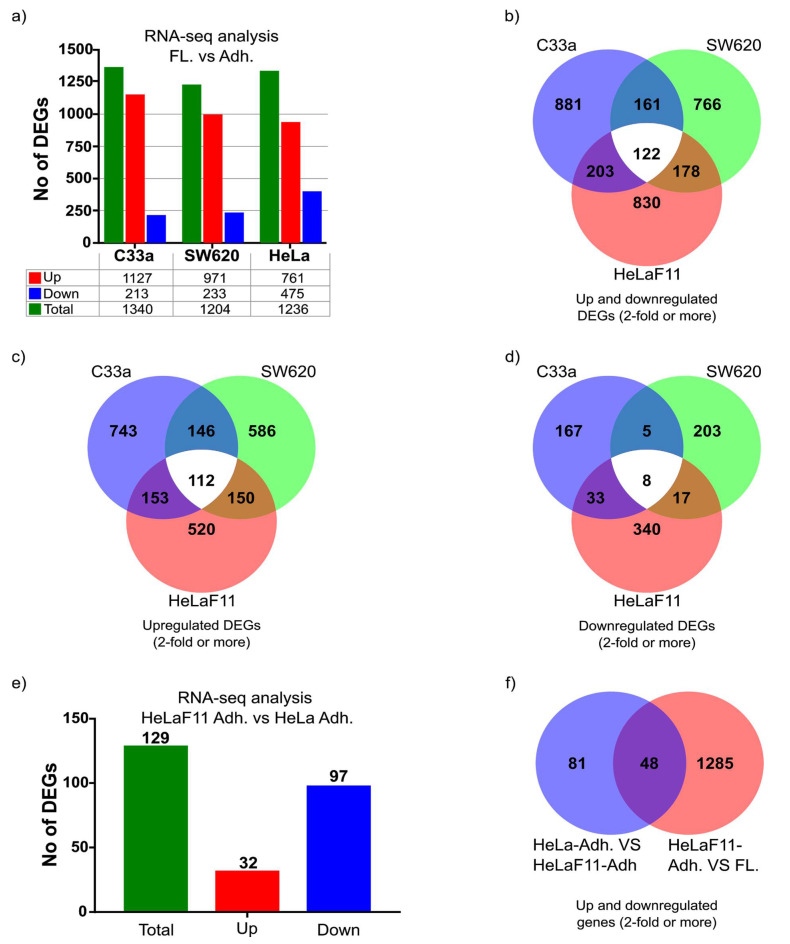
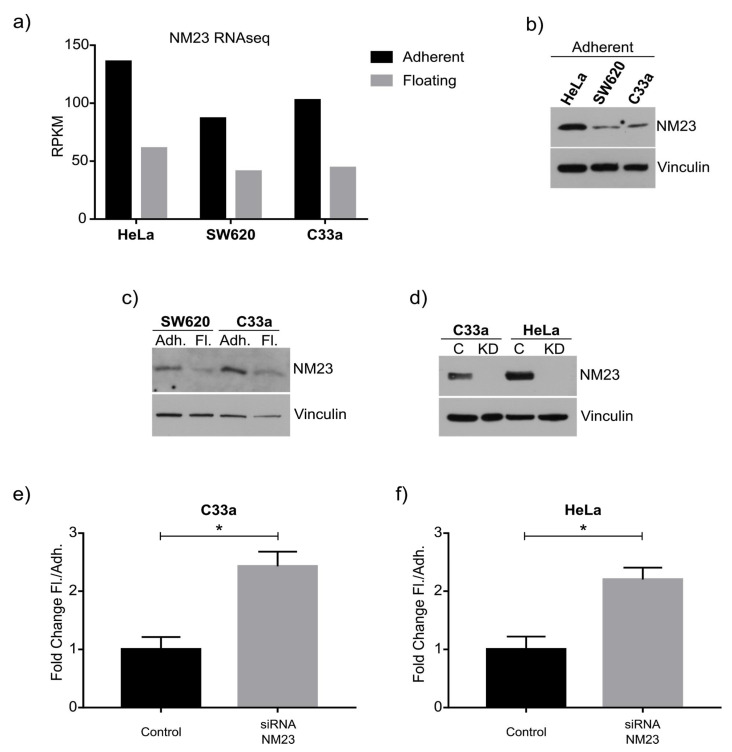
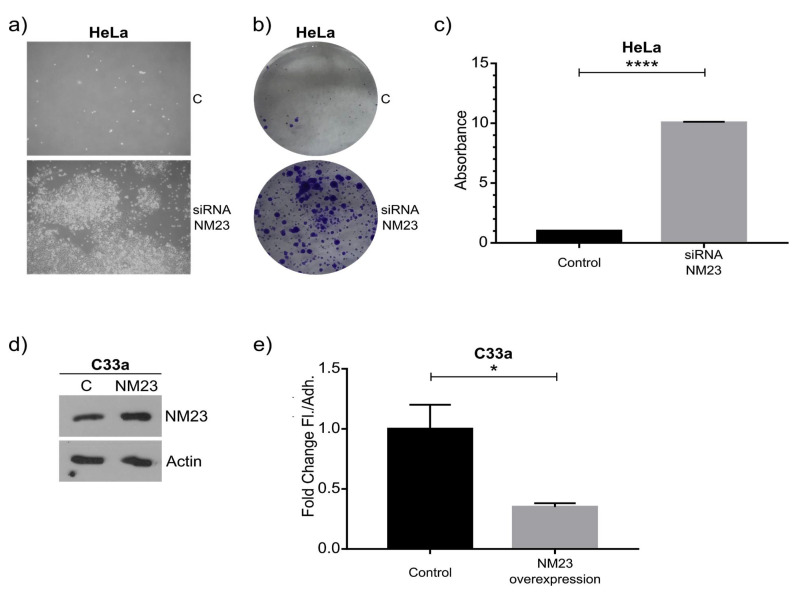
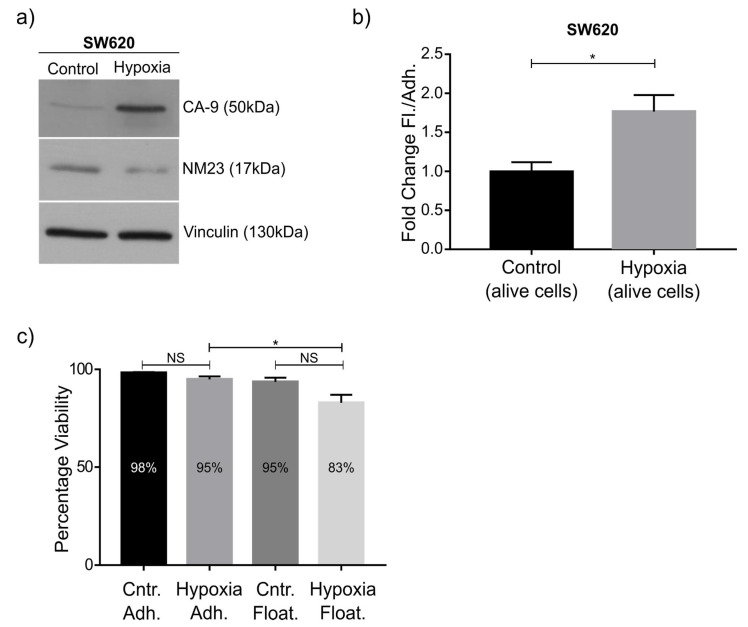
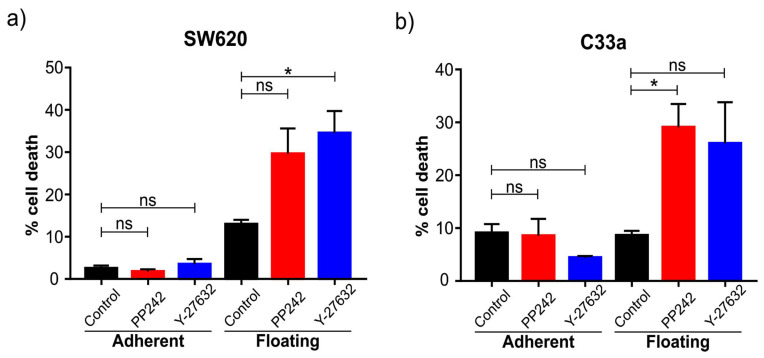
There is an unmet need for simplified in vitro models of malignancy and metastasis that facilitate fast, affordable and scalable gene and compound analysis. "Adherent" cancer cell lines frequently release "free-floating" cells into suspension that are viable and can reattach. This, in a simplistic way, mimics the metastatic process. We compared the gene expression profiles of naturally co-existing populations of floating and adherent cells in SW620 (colon), C33a (cervix) and HeLa (cervix) cancer cells. We found that 1227, 1367 and 1333 genes were at least 2-fold differentially expressed in the respective cell lines, of which 122 were shared among the three cell lines. As proof of principle, we focused on the anti-metastatic gene NM23-H1, which was downregulated both at the RNA and protein level in the floating cell populations of all three cell lines. Knockdown of NM23-H1 significantly increased the number of floating (and viable) cells, whereas overexpression of NM23-H1 significantly reduced the proportion of floating cells. Other potential regulators of these cellular states were identified through pathway analysis, including hypoxia, mTOR (mechanistic target of rapamycin), cell adhesion and cell polarity signal transduction pathways. Hypoxia, a condition linked to malignancy and metastasis, reduced NM23-H1 expression and significantly increased the number of free-floating cells. Inhibition of mTOR or Rho-associated protein kinase (ROCK) significantly increased cell death specifically in the floating and not the adherent cell population. In conclusion, our study suggests that dynamic subpopulations of free-floating and adherent cells is a useful model to screen and identify genes, drugs and pathways that regulate the process of cancer metastasis, such as cell detachment and anoikis.

Keywords: NM23; anoikis; cell detachment; cell reattachment; floating cells; mTOR; metastasis models; suspension cells.


Conflict of interest statement

The authors declare no conflict of interest. The funders had no role in the design of the study; in the collection, analyses, or interpretation of data; in the writing of the manuscript, or in the decision to publish the results.

Figures

Figure 1
Figure 1
Morphology of adherent and floating tumor cells. Examples of (a) SW620 colon, (b) HeLa cervical, and (c) C33a cervical tumor cell lines grown as adherent cell lines with the presence of some round and detached cells (arrows) which upon transfer to a new tissue culture plate will adhere within hours and establish adherent clusters again. (d) Example of C33a cells grown in low-attachment treated plastic to prevent adherence, causing increased cell–cell attachment and cluster formation of the floating cell population. Scale Bars: 50 µm.
Figure 2
Figure 2
Differential gene expression between adherent and floating cells. (a) A table summarizing the number of differentially expressed genes (DEGs) with a minimum 2-fold difference between floating (FL.) and adherent (Adh.) cell populations. (b) Venn diagram displays the shared genes between cell types where there is at least 2-fold differential expression between floating and adherent cell populations. (c) Venn diagram displays the shared genes between cell types where there is at least 2-fold upregulated expression in the floating populations compared to the adherent cell populations. (d) Venn diagram displays the shared genes between cell types where there is at least 2-fold downregulated expression in the floating populations compared to the adherent cell populations. (e) A table summarizing the number of DEGs with a minimum 2-fold difference between adherent cells from the adapted HeLaF11 cells (two days post-adherence) and adherent cells from the parental HeLa cells. (f) Venn diagram displays the shared genes between where there are at least 2-fold DEGs between both adherent (Adh.) HeLa and HeLAF11 cells and between HeLaF11 adherent and HeLaF11 floating (F.) cell populations.
Figure 3
Figure 3
Correlation between NM23-H1 and adherent and floating cell populations. (a) Table display of normalized gene expression levels RPKM (Reads Per Kilobase of transcript per Million mapped reads) of NM23-H1 as identified by RNA-sequencing, showing highest expression in adherent HeLa cells and consistent downregulation in the floating cell populations. (b) Western blot of NM23-H1 of adherent cells showing the highest expression in HeLa cells. Vinculin was used as a loading control to verify our protein quantification and loading. (c) Western blot of NM23-H1 comparing the floating and adherent cell population of SW620 and C33a cells. (d) Western blot after control (C) or siRNA-mediated knockdown (KD) of NM23-H1 in adherent C33a and HeLa cells. (ef) Quantification of fold changes in the number of floating cells compared to adherent cells, showing a significant increase in C33a cells (e) and HeLa cells (f) upon NM23-H1 knockdown. Graphs indicate standard error of the mean (SEM). * indicates statistical significance with a p-value below 0.05 based on an unpaired two-sided Student’s t-test of n = 3 independent experiments.
Figure 4
Figure 4
Functional consequences upon modulation of NM23-H1 expression. (ac) 72 h after transient siRNA-mediated knockdown of NM23-H1 in HeLa cells the floating cell population was collected and transferred to a new dish. The number of cells that have survived after 2 additional days is significantly higher upon NM23-H1 knockdown (includes floating and adherent cells). The number of adherent colonies established (7 days post-transfection, with NM23-H1 expression expected to largely recover from transient siRNA knockdown at this late stage) is shown by crystal violet staining (b) and was statistically significant upon quantification (c). (d) Western blot of NM23-H1 of C33a cells upon control or NM23-H1 overexpression (calculated as 1.7-fold increased). (e) Quantification of fold change changes comparing the number of floating cells compared to adherent cells showing a significant decrease of floating cells upon NM23-H1 overexpression. Graphs indicate standard error of the mean (SEM). **** indicates statistical significance with a p-value below 0.0001 based on an unpaired two-sided Student’s t-test of n = 2 independent experiments. * indicates statistical significance with a p-value below 0.05 based on an unpaired two-sided Student’s t-test of n = 3 independent experiments.
Figure 5
Figure 5
Treatment of SW620 cells to hypoxia. (a) Western blot showing upregulation of the hypoxia marker carbonic anhydrase 9 (CA-9) after growing SW620 cells for 48 h under hypoxic conditions (0.5% oxygen). Downregulation of NM23-H1 was observed (calculated as 2.1-fold). (b) Quantification of fold changes in the number of floating cells compared to adherent SW620 cells, showing a significant increase in the ratio of floating cells upon hypoxia. (c) No statistically significant change in the number of dead cells was observed for either adherent or floating cell populations under hypoxic conditions. Graphs indicate standard error of the mean (SEM). * indicates statistical significance with a p-value below 0.05 based on an unpaired two-sided Student’s t-test (b) and one-way ANOVA with Tukey’s multiple comparisons test (c) of n = 3 independent experiments.
Figure 6
Figure 6
Cell death of adherent and floating cells in response to pathway inhibitors. SW620 cells (a) and C33a cells (b) were treated for 6 h with either the mTOR inhibitor PP242 or the ROCK inhibitor Y-27632. Compared to control cells (DMSO vehicle-treated), a significant increase in cell death was observed in the floating cell populations but not the adherent cell populations. Graphs indicate standard error of the mean (SEM). The star (*) indicates statistical significance with a p-value below 0.05 based upon ordinary one-way ANOVA with Tukey’s multiple comparisons test. n = 3 independent experiments.

Similar articles

Cited by

References

    1. Buchheit C.L., Weigel K.J., Schafer Z.T. Cancer Cell Survival during Detachment from the ECM: Multiple Barriers to Tumour Progression. Nat. Rev. Cancer. 2014;14:632–641. doi: 10.1038/nrc3789. - DOI - PubMed
    1. Bersini S., Jeon J.S., Moretti M., Kamm R.D. In Vitro Models of the Metastatic Cascade: From Local Invasion to Extravasation. Drug Discov. Today. 2014;19:735–742. doi: 10.1016/j.drudis.2013.12.006. - DOI - PMC - PubMed
    1. Weiswald L.-B., Bellet D., Dangles-Marie V. Spherical Cancer Models in Tumor Biology. Neoplasia. 2015;17:1–15. doi: 10.1016/j.neo.2014.12.004. - DOI - PMC - PubMed
    1. Albritton J.L., Miller J.S. 3D Bioprinting: Improving in Vitro Models of Metastasis with Heterogeneous Tumor Microenvironments. Dis. Model. Mech. 2017;10:3–14. doi: 10.1242/dmm.025049. - DOI - PMC - PubMed
    1. Perkhofer L., Frappart P.-O., Müller M., Kleger A. Importance of Organoids for Personalized Medicine. Per. Med. 2018;15:461–465. doi: 10.2217/pme-2018-0071. - DOI - PubMed

MeSH terms

Substances