

Chronic Alcohol Exposure of Cells Using Controlled Alcohol-Releasing Capillaries
- PMID: 34066517
- PMCID: PMC8148542
- DOI: 10.3390/cells10051120
Chronic Alcohol Exposure of Cells Using Controlled Alcohol-Releasing Capillaries
Abstract
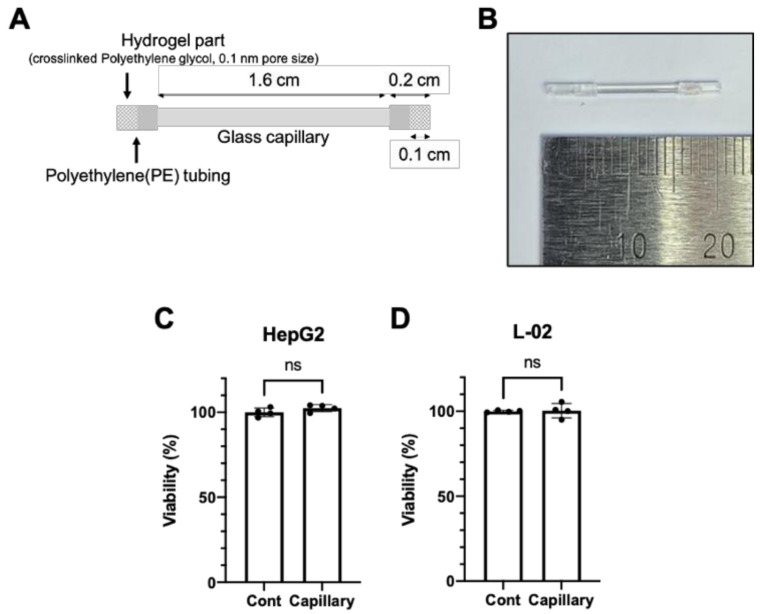
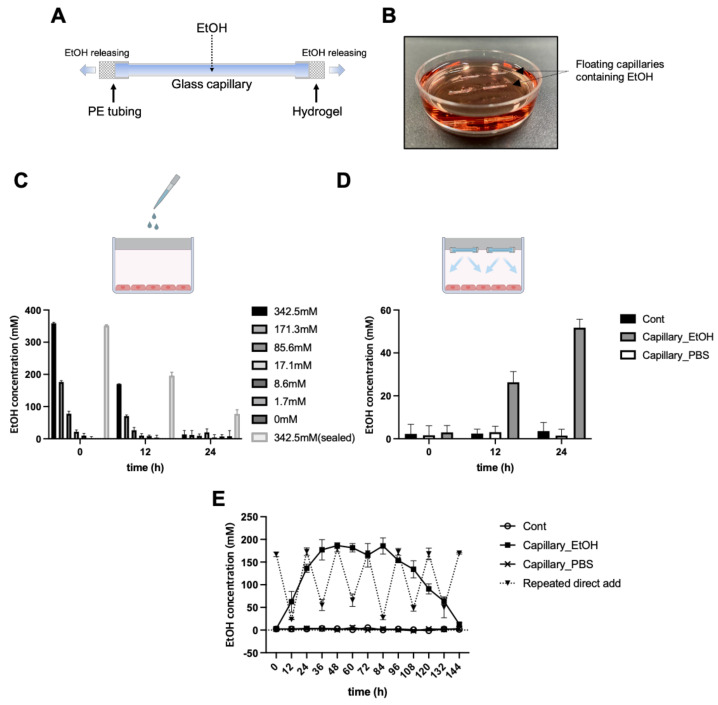
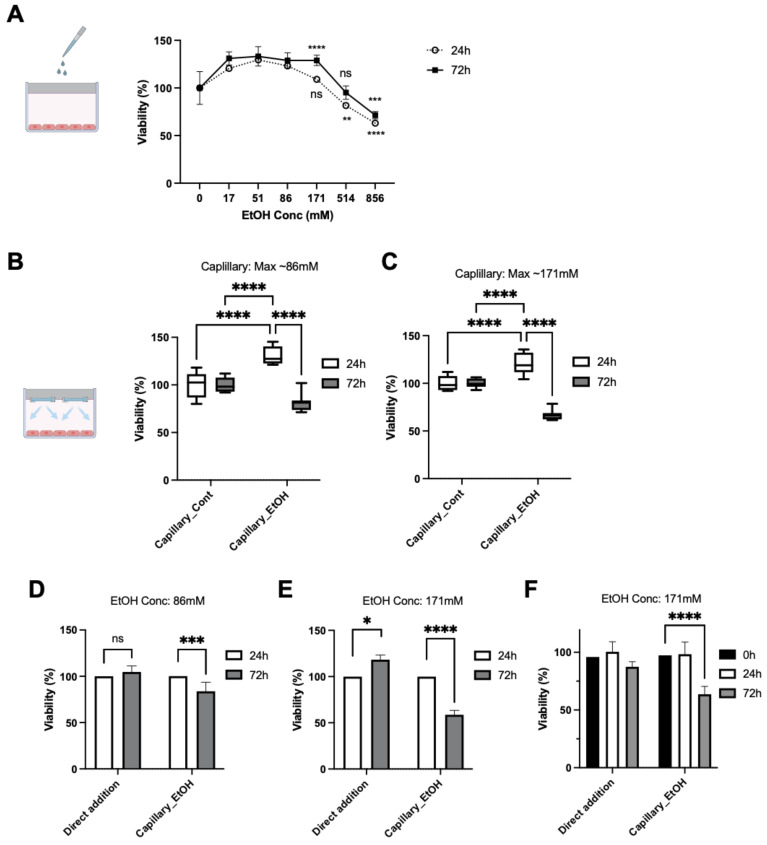
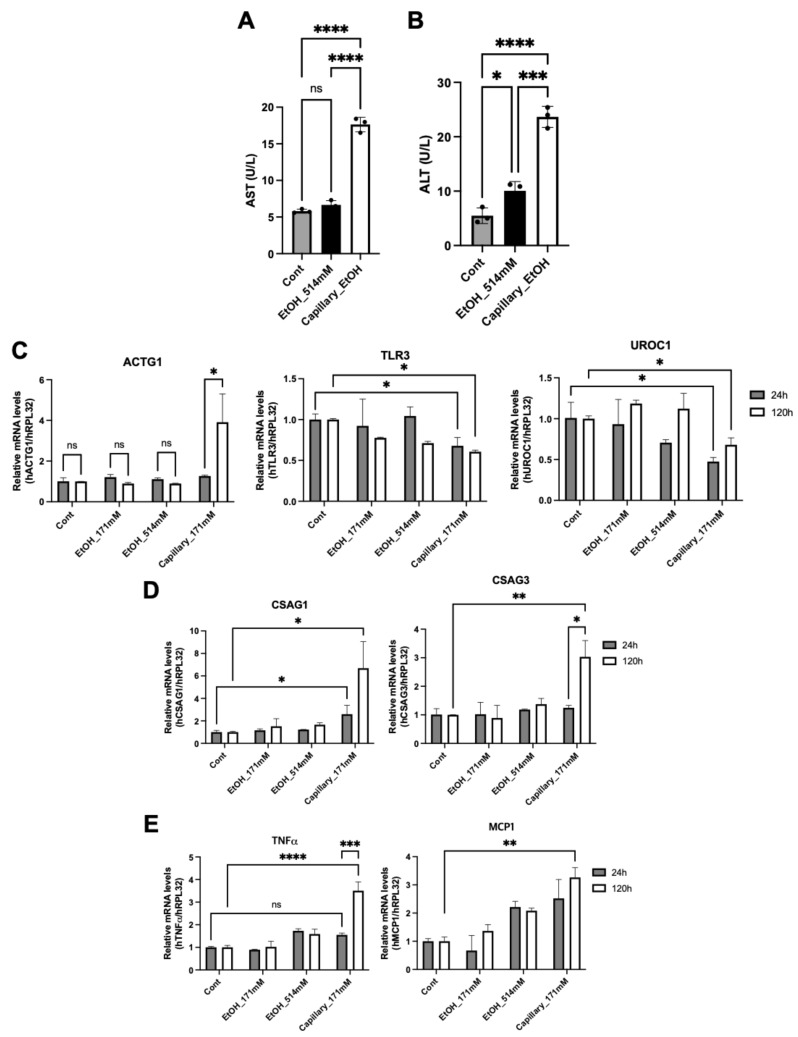
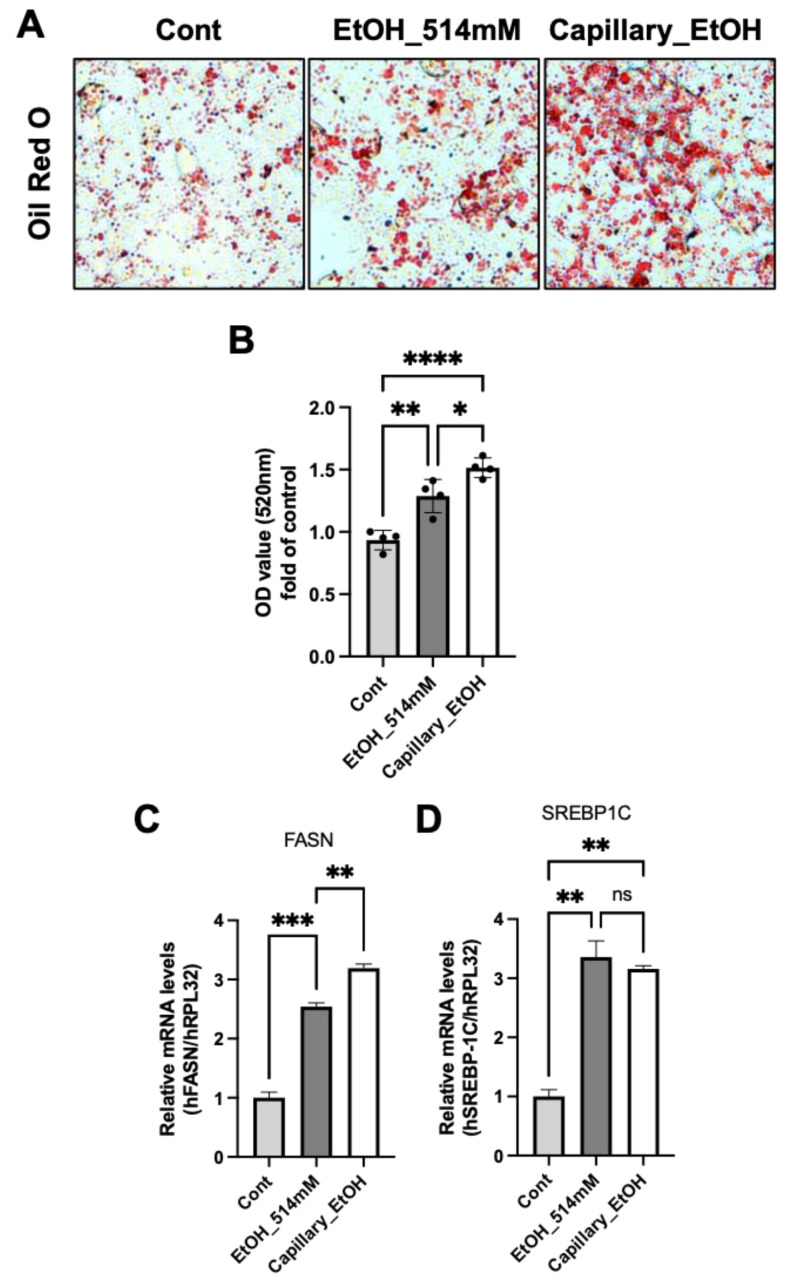
Alcohol is one of the main causes of liver diseases such as fatty liver, alcoholic hepatitis, and chronic hepatitis with liver fibrosis or cirrhosis. To reproduce the conditions of alcohol-induced liver diseases and to identify the disease-causing mechanisms at the cellular level, several methods have been used to expose the cells to ethanol. As ethanol evaporates easily, it is difficult to mimic chronic alcohol exposure conditions at the cellular level. In this study, we developed a glass capillary system containing ethanol, which could steadily release ethanol from the polyethylene tubing and hydrogel portion at both sides of the capillary. The ethanol-containing capillary could release ethanol in the cell culture medium for up to 144 h, and the concentration of ethanol in the cell culture medium could be adjusted by controlling the number of capillaries. A long-term exposure to ethanol by the capillary system led to an increased toxicity of cells and altered the cellular physiologies, such as increasing the lipid accumulation and hepatic transaminase release in cells, as compared to the traditional direct ethanol addition method. Ethanol capillaries showed different gene expression patterns of lipid accumulation- or chronic alcoholism-related genes. Our results suggest that our ethanol-containing capillary system can be used as a valuable tool for studying the mechanism of chronic alcohol-mediated hepatic diseases at the cellular level.
Keywords: alcohol; capillary; chronic; liver.
Conflict of interest statement
The authors declare no conflict of interest.
Figures
Similar articles
-
Mimicking chronic alcohol effects through a controlled and sustained ethanol release device.J Biol Eng. 2024 May 7;18(1):31. doi: 10.1186/s13036-024-00428-1. J Biol Eng. 2024. PMID: 38715085 Free PMC article.
-
Metabolic derivatives of alcohol and the molecular culprits of fibro-hepatocarcinogenesis: Allies or enemies?World J Gastroenterol. 2016 Jan 7;22(1):50-71. doi: 10.3748/wjg.v22.i1.50. World J Gastroenterol. 2016. PMID: 26755860 Free PMC article. Review.
-
Mouse Model of Alcoholic Steatohepatitis.Methods Mol Biol. 2020;2164:145-157. doi: 10.1007/978-1-0716-0704-6_15. Methods Mol Biol. 2020. PMID: 32607891
-
Alcohol, microbiome, life style influence alcohol and non-alcoholic organ damage.Exp Mol Pathol. 2017 Feb;102(1):162-180. doi: 10.1016/j.yexmp.2017.01.003. Epub 2017 Jan 7. Exp Mol Pathol. 2017. PMID: 28077318 Review.
-
Proteomic Profiling of Liver and Plasma in Chronic Ethanol Feeding Model of Hepatic Alcohol Dehydrogenase-Deficient Deer Mice.Alcohol Clin Exp Res. 2017 Oct;41(10):1675-1685. doi: 10.1111/acer.13470. Epub 2017 Sep 8. Alcohol Clin Exp Res. 2017. PMID: 28792616 Free PMC article.
Cited by
-
Ethanol-exposed lung fibroblasts cause airway epithelial barrier dysfunction.Alcohol Clin Exp Res (Hoboken). 2023 Oct;47(10):1839-1849. doi: 10.1111/acer.15174. Epub 2023 Aug 29. Alcohol Clin Exp Res (Hoboken). 2023. PMID: 37864530 Free PMC article.
-
Inhibition of Abelson Tyrosine-Protein Kinase 2 Suppresses the Development of Alcohol-Associated Liver Disease by Decreasing PPARgamma Expression.Cell Mol Gastroenterol Hepatol. 2023;16(5):685-709. doi: 10.1016/j.jcmgh.2023.07.006. Epub 2023 Jul 15. Cell Mol Gastroenterol Hepatol. 2023. PMID: 37460041 Free PMC article.
-
Mimicking chronic alcohol effects through a controlled and sustained ethanol release device.J Biol Eng. 2024 May 7;18(1):31. doi: 10.1186/s13036-024-00428-1. J Biol Eng. 2024. PMID: 38715085 Free PMC article.
-
Oxidative stress in a cellular model of alcohol-related liver disease: protection using curcumin nanoformulations.Sci Rep. 2025 Mar 5;15(1):7752. doi: 10.1038/s41598-025-91139-0. Sci Rep. 2025. PMID: 40044747 Free PMC article.
-
Establishment of a Simple and Versatile Evaporation Compensation Model for in vitro Chronic Ethanol Treatment: Impact on Neuronal Viability.Neuroglia. 2022 Jun;3(2):61-72. doi: 10.3390/neuroglia3020004. Epub 2022 Apr 6. Neuroglia. 2022. PMID: 37981908 Free PMC article.
References
-
- SAMHSA Table 2.1B—Tobacco Product and Alcohol Use in Lifetime, Past Year, and Past Month among Persons Aged 12 or Older, by Age Group: Percentages, 2018 and 2019. [(accessed on 6 May 2021)]; Available online: https://www.samhsa.gov/data/sites/default/files/reports/rpt29394/NSDUHDe....
-
- CDC. Annual Average for United States 2011–2015 Alcohol-Attributable Deaths Due to Excessive Alcohol Use, All Ages, 2020. Alcohol and Public Health: Alcohol-Relat. Related Disease Impact (ARDI) [(accessed on 6 May 2021)]; Available online: https://nccd.cdc.gov/DPH_ARDI/Default/Report.aspx?T=AAM&P=1A04A664-0244-....
-
- National Highway Traffic Safety Administration. 2014 Crash Data Key Findings, 2015. Traffic Safety Facts Crash Stats. [(accessed on 6 May 2021)]; Available online: https://crashstats.nhtsa.dot.gov/Api/Public/ViewPublication/812219.
Publication types
MeSH terms
Substances
Grants and funding
LinkOut - more resources
Full Text Sources
Research Materials
