. 2021 May 8;14(5):444.
doi: 10.3390/ph14050444.

Hexarelin Modulation of MAPK and PI3K/Akt Pathways in Neuro-2A Cells Inhibits Hydrogen Peroxide-Induced Apoptotic Toxicity

Affiliations

Hexarelin Modulation of MAPK and PI3K/Akt Pathways in Neuro-2A Cells Inhibits Hydrogen Peroxide-Induced Apoptotic Toxicity

Ramona Meanti et al. Pharmaceuticals (Basel). .

Abstract

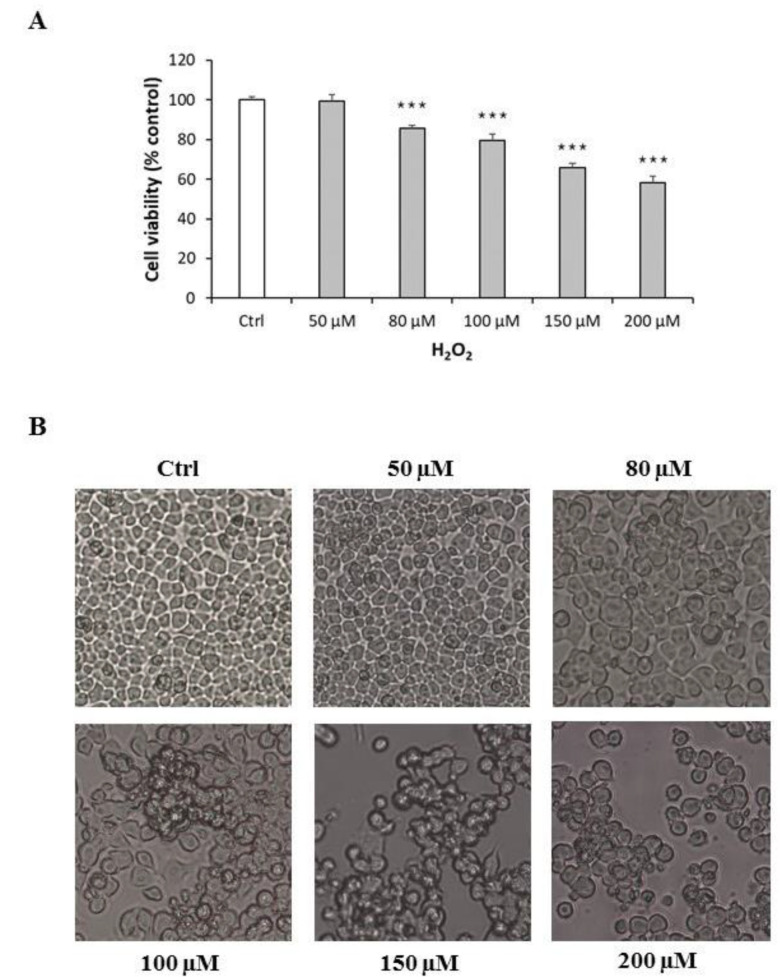
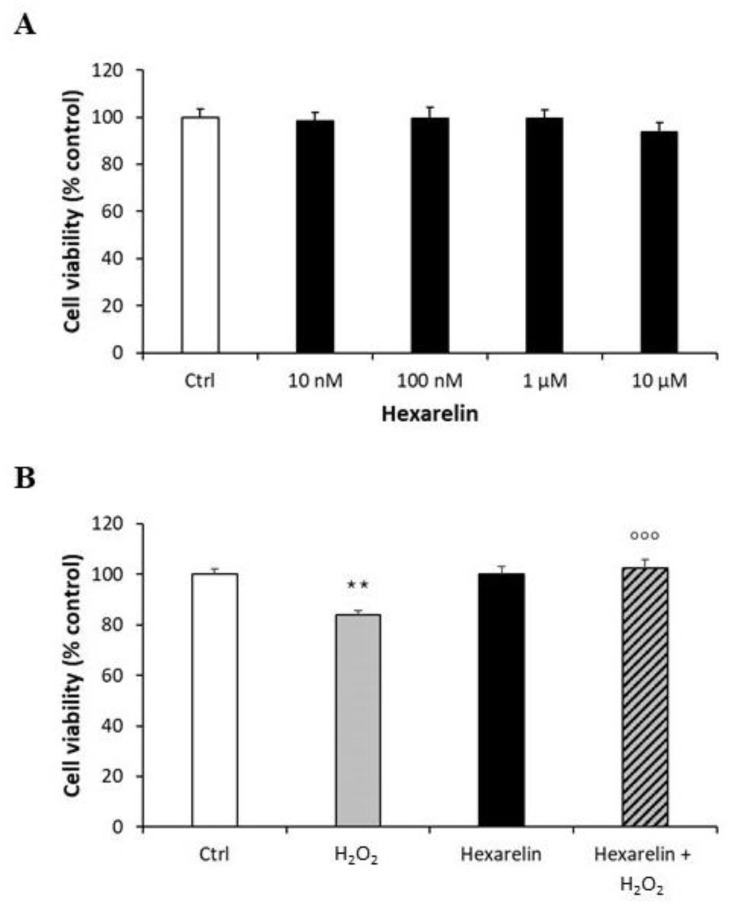
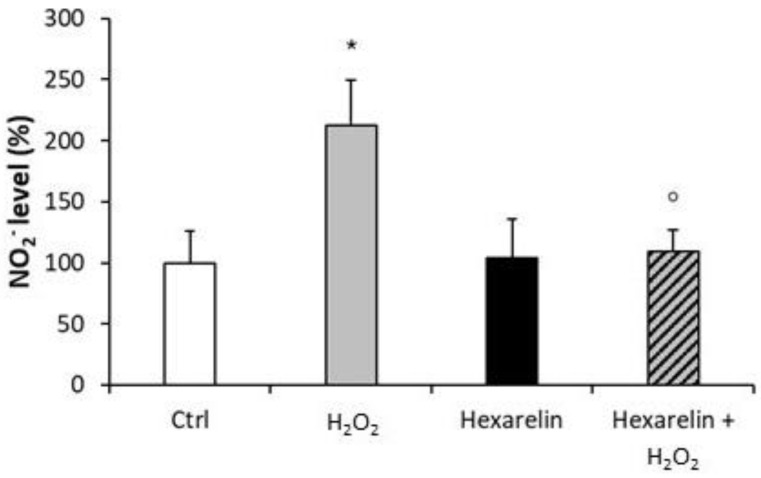
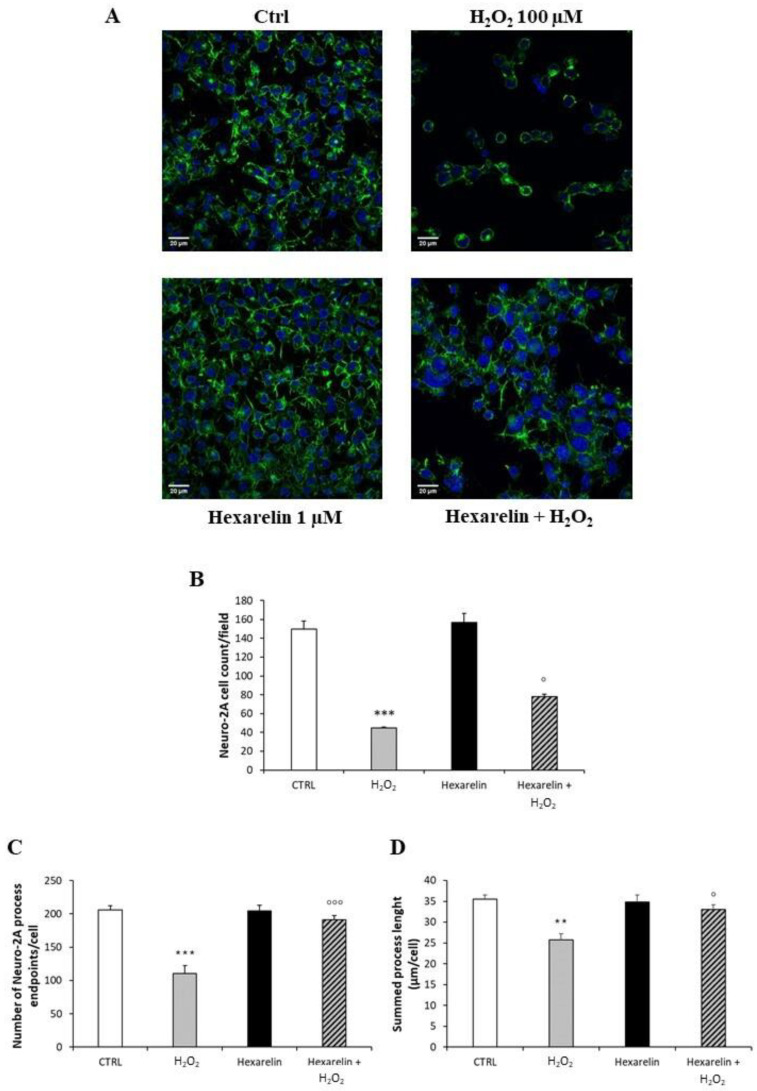
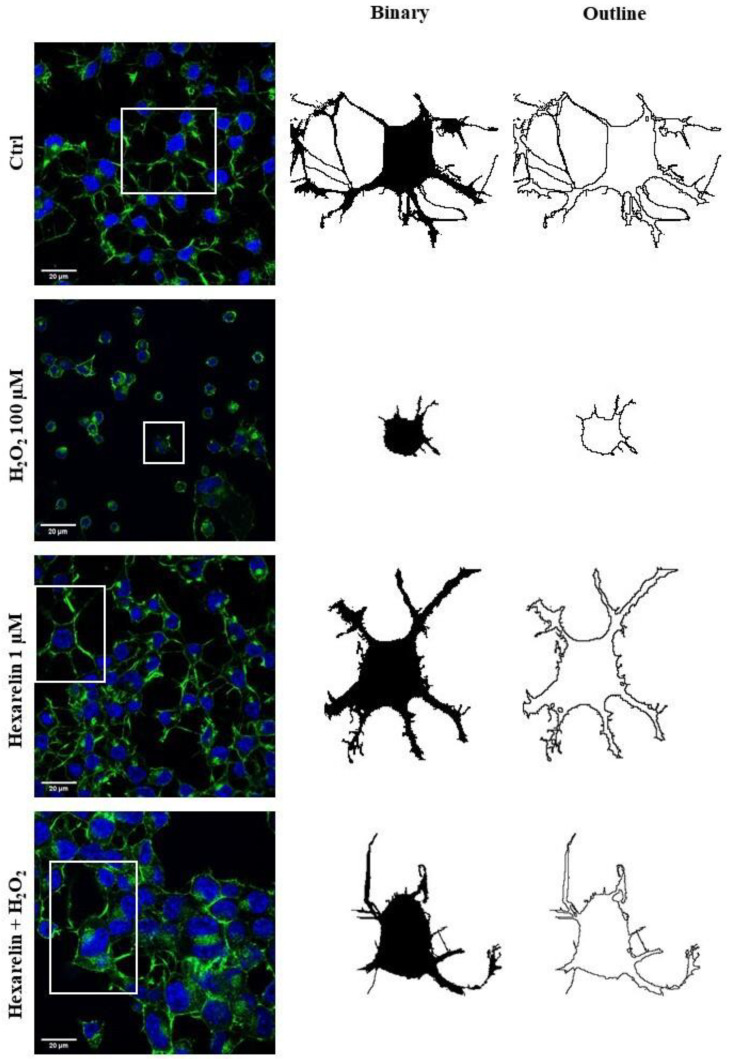
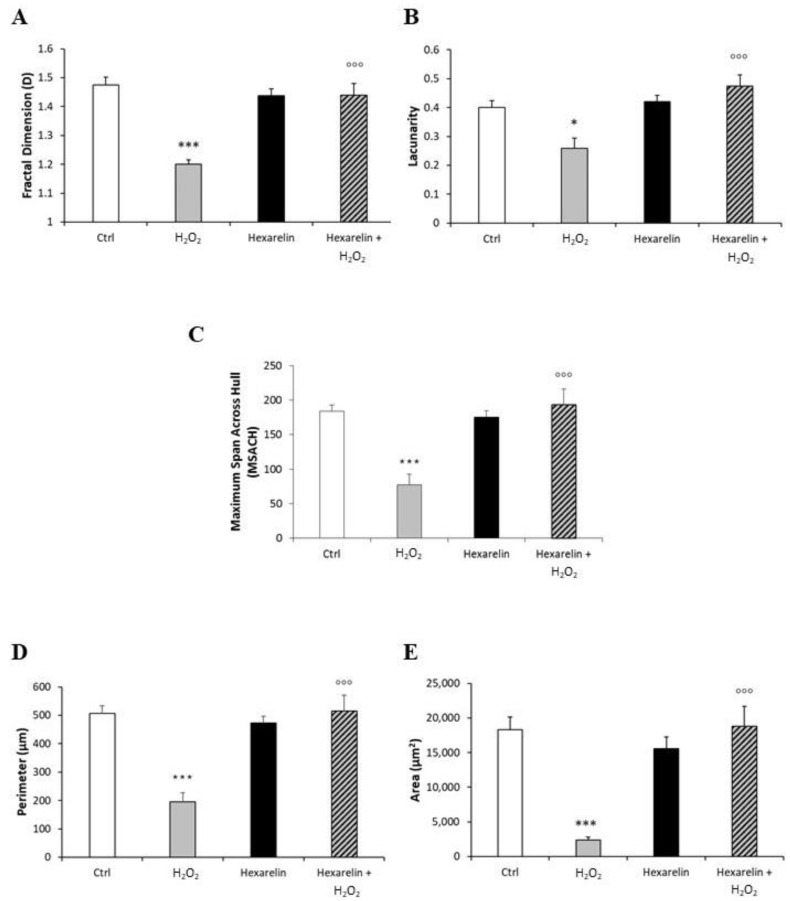
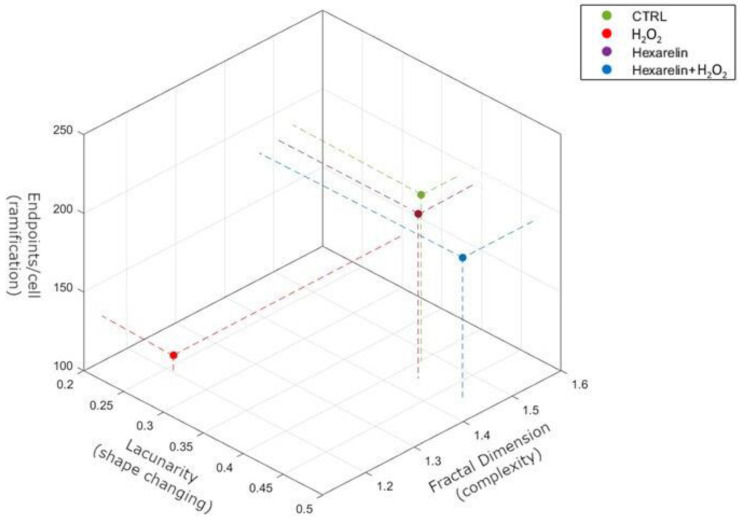
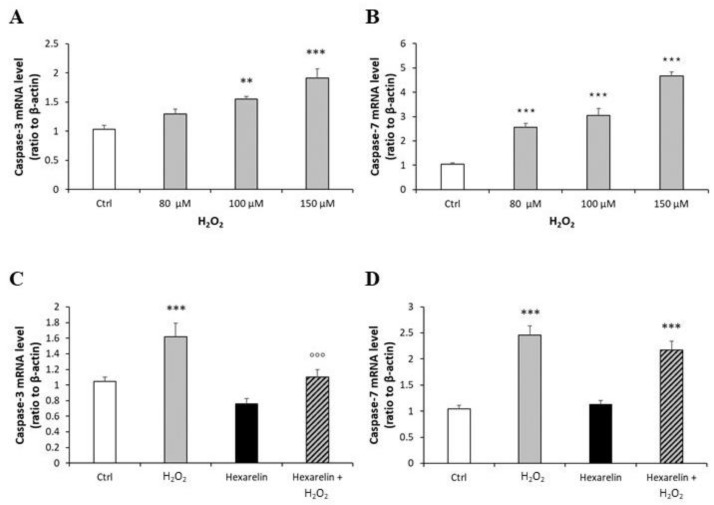
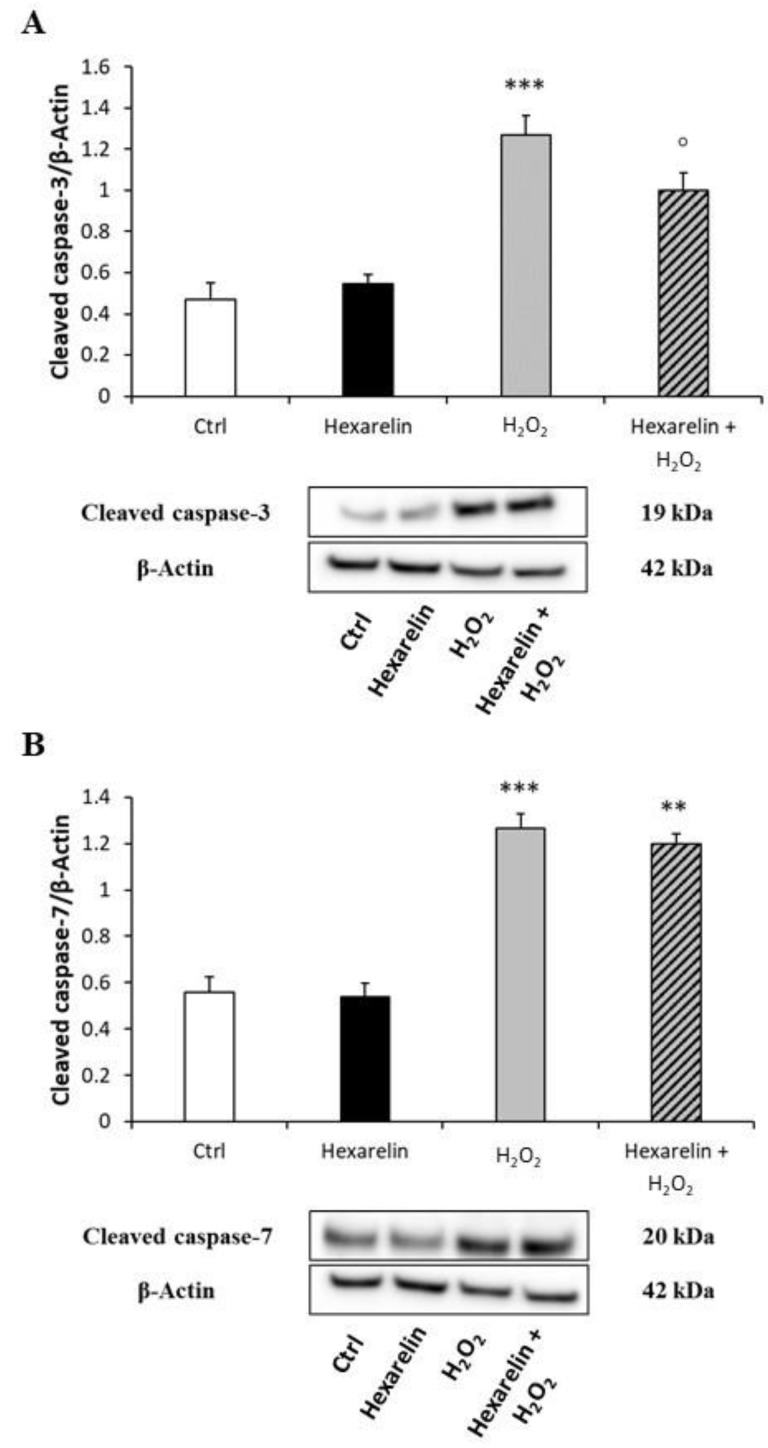
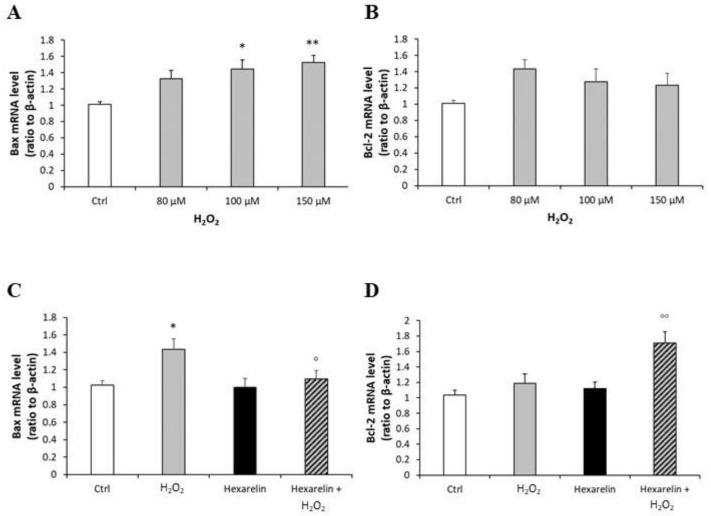
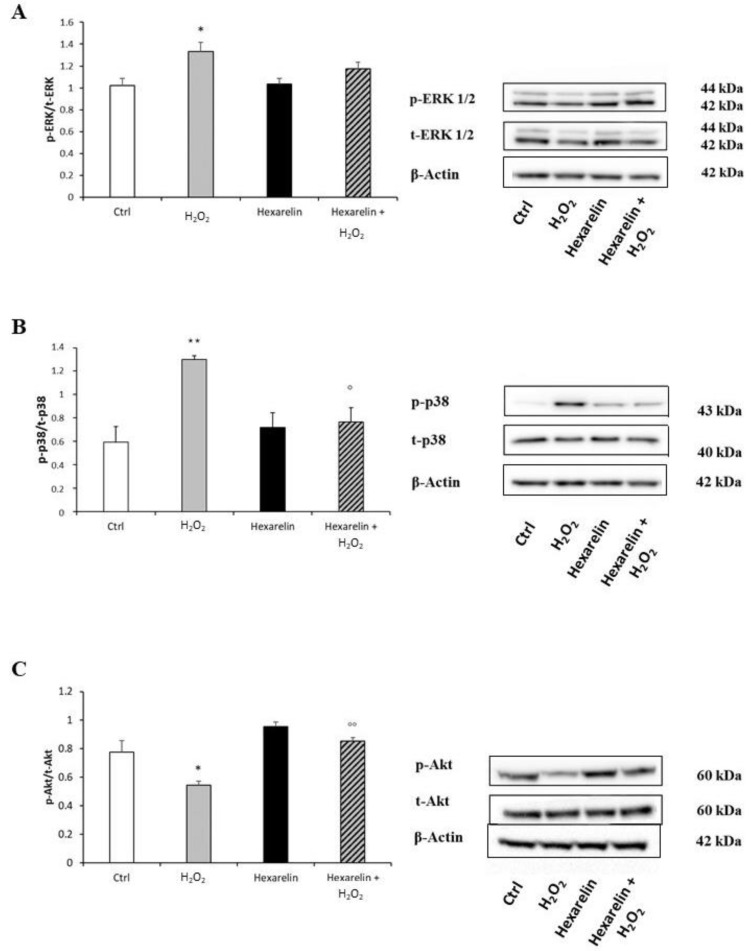
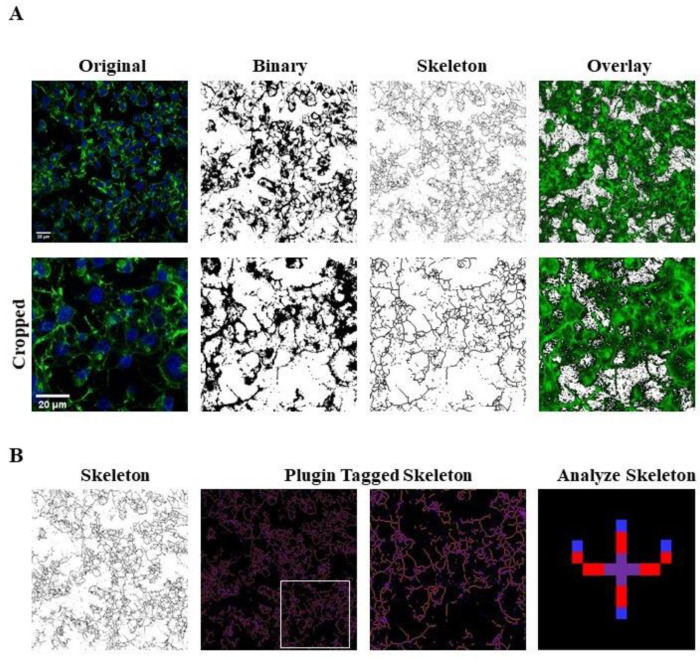
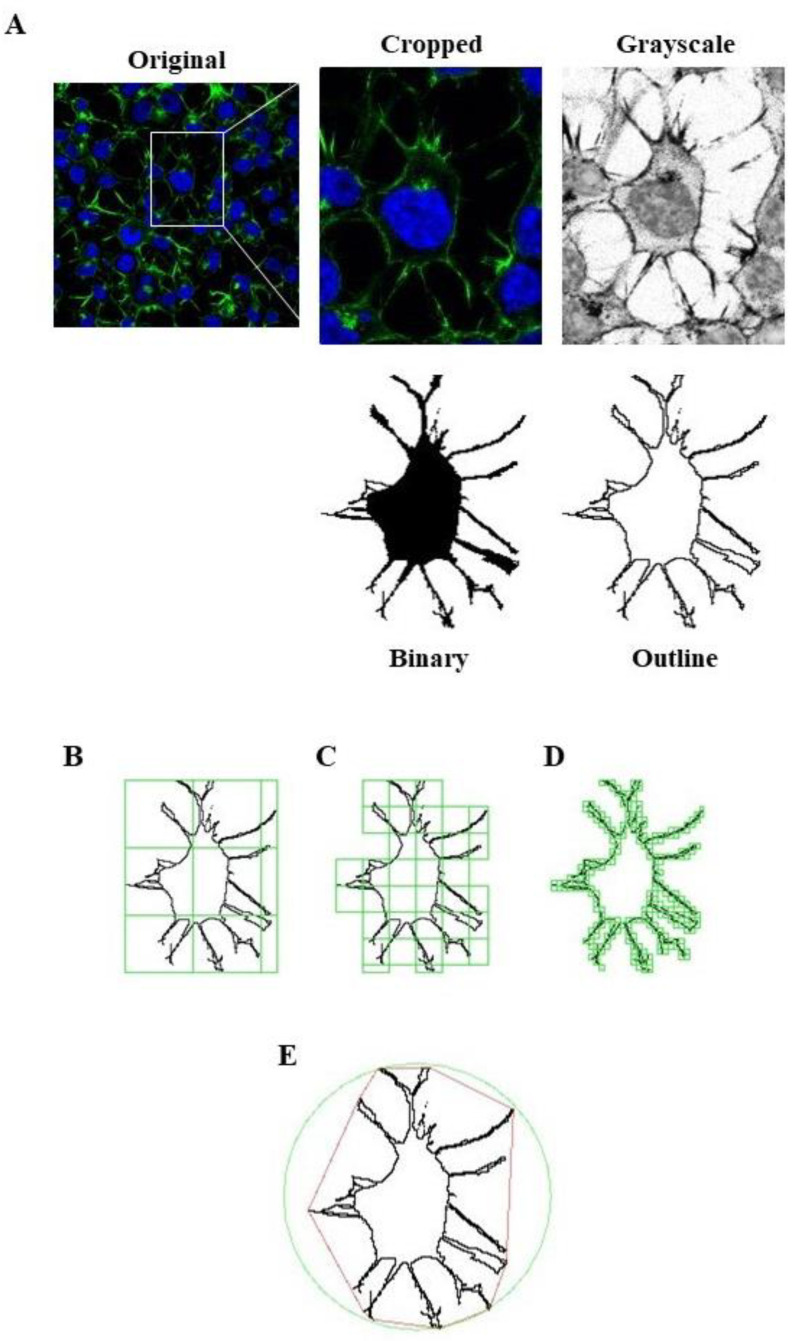
Hexarelin, a synthetic hexapeptide, exerts cyto-protective effects at the mitochondrial level in cardiac and skeletal muscles, both in vitro and in vivo, may also have important neuroprotective bioactivities. This study examined the inhibitory effects of hexarelin on hydrogen peroxide (H2O2)-induced apoptosis in Neuro-2A cells. Neuro-2A cells were treated for 24 h with various concentrations of H2O2 or with the combination of H2O2 and hexarelin following which cell viability and nitrite (NO2-) release were measured. Cell morphology was also documented throughout and changes arising were quantified using Image J skeleton and fractal analysis procedures. Apoptotic responses were evaluated by Real-Time PCR (caspase-3, caspase-7, Bax, and Bcl-2 mRNA levels) and Western Blot (cleaved caspase-3, cleaved caspase-7, MAPK, and Akt). Our results indicate that hexarelin effectively antagonized H2O2-induced damage to Neuro-2A cells thereby (i) improving cell viability, (ii) reducing NO2- release and (iii) restoring normal morphologies. Hexarelin treatment also reduced mRNA levels of caspase-3 and its activation, and modulated mRNA levels of the BCL-2 family. Moreover, hexarelin inhibited MAPKs phosphorylation and increased p-Akt protein expression. In conclusion, our results demonstrate neuroprotective and anti-apoptotic effects of hexarelin, suggesting that new analogues could be developed for their neuroprotective effects.

Keywords: GHS; apoptosis; hexarelin; hydrogen peroxide; neuroprotection; oxidative stress.


Conflict of interest statement

The authors declare no conflict of interest.

Figures

Figure 1
Figure 1
Cytotoxic effect and morphological alterations of Neuro-2A cells in response to increasing concentration of H2O2. (A) Neuro-2A cells were treated for 24 h with different concentrations of H2O2 (0, 50, 80, 100, 150, 200 μM) and assessed for MTT assay. The assay was performed in at least three independent experiments (n = 21). Statistical significance: *** p < 0.001 vs. CTRL. (B) Morphological changes in Neuro-2A cells were observed by Motic AE2000 Inverted Microscope, at 10× magnification. Representative images of cells treated with increasing concentration of H2O2.
Figure 2
Figure 2
Protective action of hexarelin in Neuro2A cells. (A) Neuro-2A cells were treated for 24 h with different concentrations of hexarelin (10 nM, 100 nM, 1 µM, and 10 µM), (B) with or without hexarelin (1 µM) and H2O2 (100 μM) and assessed for MTT assay. All assays were performed in at least three independent experiments (n = 21). Statistical significance: ** p < 0.01 vs. CTRL; °°° p < 0.001 vs. H2O2.
Figure 3
Figure 3
Hexarelin reduced the extracellular NO2 release induced by H2O2. Neuro-2A cells were treated for 24 h with or without hexarelin and 100 µM H2O2. The culture media were used for Griess reaction to measure NO2 extracellular release. Data are expressed as mean ± SEM of 4 replicates (n = 24). Statistical significance: * p < 0.05 vs. CTRL; ° p < 0.05 vs. H2O2.
Figure 4
Figure 4
Hexarelin reduces Neuro-2A cells de-ramification induced by H2O2. (A) Neuro-2A cells were seeded on poly-D-lysine pre-treated coverslips and incubated for 24 h with or without hexarelin and 100 µM H2O2. At the end of the treatment, cells were fixed and stained for phalloidin and DAPI. Images were captured with confocal laser scan microscope. Scale bar: 20 µm. (B) Graphical representation of the number of cells in the same areas per each treatment, (C) of the process endpoints/cells and (D) process length/cells. Data are expressed as mean ± SEM of 3 replicates (total number of cells analyzed = 160). Statistical significance: ** p < 0.01, *** p < 0.001 vs. CTRL; ° p < 0.05, °°° p < 0.001 vs. H2O2.
Figure 5
Figure 5
Effects of hexarelin on morphology of Neuro-2A cells stimulated with H2O2. Representative photomicrographs of Neuro-2A cells incubated for 24 h with or without hexarelin and 100 µM H2O2, and examples of cell binarized and outlined. Cells were seeded on poly-D-lysine pre-treated coverslips and, at the end of the treatments, were fixed and stained with phalloidin and DAPI. Images were captured with a confocal laser scan microscope. Scale bar: 20 µm.
Figure 6
Figure 6
Hexarelin modulates morphological changes of Neuro-2A cells induced by H2O2 treatment. (A) Fractal dimension, (B) lacunarity, (C) maximum span across hull, (D) perimeter, and (E) area graphical representation of Neuro-2A cells treated for 24 h with or without hexarelin and 100 µM H2O2. Total number of cells analyzed for each condition = 10. Data are expressed as mean ± SEM. Statistical significance: * p < 0.05, *** p < 0.001 vs. CTRL; °°° p < 0.001 vs. H2O2.
Figure 7
Figure 7
Summary representation of Skeleton and FracLac analysis by 3D scatter plot. The figure summarizes the relationship between ramifications (endpoints/cell), shape changing (lacunarity) and complexity (fractal dimension). Pearson’s correlation demonstrates that fractal dimension significantly correlates with endpoints/cell (r = 0.9806, p = 0.0098) but not with lacunarity (r = 0.8134, p = 0.0981). Endpoints/cell directly correlates with both fractal dimension (r = 0.9806, p = 0.0098) and lacunarity (r = 0.7765, p = 0.0038).
Figure 8
Figure 8
Analysis of caspase-3 and caspase-7 mRNA levels following H2O2 exposure and their modulation induced by hexarelin. Neuro-2A cells were treated with different concentrations of H2O2 (80, 100, 150 μM) or co-incubated with 1 µM hexarelin and 100 µM H2O2 for 24 h. Caspase-3 (A,C) and caspase-7 (B,D) mRNA levels were measured by RT-PCR and normalized for the respective β-actin mRNA levels. Data are expressed as mean ± SEM of 3 replicates (n = 18). ** p < 0.01, *** p < 0.001 vs. CTRL; °°° p < 0.001 vs. H2O2.
Figure 9
Figure 9
Hexarelin inhibits apoptotic pathway through caspase-3 inactivation. Neuro-2A cells were treated with or without hexarelin and H2O2 for 24 h and assessed in Western blot for cleaved caspase-3/β-actin (A), and cleaved caspase-7/β-actin (B). All assays were performed in at least 3 independent experiments (n = 3). Statistical significance: ** p < 0.01, *** p < 0.001 vs. CTRL; ° p < 0.05 vs. H2O2.
Figure 10
Figure 10
Analysis of mRNA levels of apoptosis markers following H2O2 exposure and their modulation induced by hexarelin. Neuro-2A cells were treated with different concentrations of H2O2 (80, 100, 150 μM) or co-incubated with hexarelin 1 µM and H2O2 100 µM for 24 h. Bax (A,C) and Bcl-2 (B,D) mRNA levels were normalized for the respective β-actin mRNA levels. Data are expressed as mean ± SEM of 3 replicates (n = 18). * p < 0.05, ** p < 0.01 vs. CTRL; ° p < 0.05, °° p < 0.01 vs. H2O2.
Figure 11
Figure 11
Hexarelin modulates ERK, p38 and Akt activation. Neuro-2A cells were treated with or without hexarelin and H2O2 for 24 h and Western blot was used to measure p-ERK/t-ERK (A), p-p38/t-p38 (B), and p-Akt/t-Akt (C) levels. β-actin was used to control even protein loading in all lines. All assays were performed at least 3 independent experiments. Statistical significance: * p < 0.05, ** p < 0.01 vs. CTRL; ° p > 0.05, °° p < 0.01 vs. H2O2.
Figure 12
Figure 12
Skeleton Analysis application to quantify Neuro-2A cells morphology. (A) Representative photomicrograph (40× magnification) and the series of ImageJ plugin protocols which were applied to each photomicrograph for skeleton analysis. Original photomicrograph was modified enhancing the background, removing noise and using with FFT filter prior to be converted to binary images. Binary image was skeletonized. The overlay of skeletonized and original images is reported; cropped photomicrographs show the image details. Scale bar: 20 µm. (B) The workflow used to Analyze Skeleton plugin: skeletonized process in orange, endpoint in blue, and junction in purple.
Figure 13
Figure 13
FracLac Analysis application to quantify Neuro-2A cells morphology. (A) Representative process applied to obtain an outlined single cell for FracLac plugin. After selecting a cell in the photomicrograph (63× magnification), the image was cropped and modified to remove noise and enhance the background. The image was then processed to obtain an 8-bit grayscale microphotograph, and binarized. Binary image was manually edited to clear the background and to join all branches, and finally outlined. FracLac quantifies cell complexity and shape with a box counting method which permits to quantify fractal dimension (B), lacunarity (C), perimeter (D), and the maximum span across the convex hull (E) by drawing a convex hull (pink) and a bounding circle (green).

Similar articles

Cited by

References

    1. Fowkes M.M., LaLonde T., Yu L., Dhanvantari S., Kovacs M.S., Luyt L.G. Peptidomimetic growth hormone secretagogue derivatives for positron emission tomography imaging of the ghrelin receptor. Eur. J. Med. Chem. 2018;157:1500–1511. doi: 10.1016/j.ejmech.2018.08.062. - DOI - PubMed
    1. Arvat E., Broglio F., Aimaretti G., Benso A., Giordano R., Deghenghi R., Ghigo E. Ghrelin and synthetic GH secretagogues. Best Pr. Res. Clin. Endocrinol. Metab. 2002;16:505–517. doi: 10.1053/beem.2002.0213. - DOI - PubMed
    1. Bresciani E., Rizzi L., Coco S., Molteni L., Meanti R., Locatelli V., Torsello A. Growth Hormone Secretagogues and the Regulation of Calcium Signaling in Muscle. Int. J. Mol. Sci. 2019;20:4361. doi: 10.3390/ijms20184361. - DOI - PMC - PubMed
    1. Conte E., Bresciani E., Rizzi L., Cappellari O., De Luca A., Torsello A., Liantonio A. Cisplatin-Induced Skeletal Muscle Dysfunction: Mechanisms and Counteracting Therapeutic Strategies. Int. J. Mol. Sci. 2020;21:1242. doi: 10.3390/ijms21041242. - DOI - PMC - PubMed
    1. Sirago G., Conte E., Fracasso F., Cormio A., Fehrentz J.-A., Martinez J., Musicco C., Camerino G.M., Fonzino A., Rizzi L., et al. Growth hormone secretagogues hexarelin and JMV2894 protect skeletal muscle from mitochondrial damages in a rat model of cisplatin-induced cachexia. Sci. Rep. 2017;7:13017. doi: 10.1038/s41598-017-13504-y. - DOI - PMC - PubMed