. 2021 May 8;12(5):422.
doi: 10.3390/insects12050422.

OBP14 (Odorant-Binding Protein) Sensing in Adelphocoris lineolatus Based on Peptide Nucleic Acid and Graphene Oxide

Affiliations

OBP14 (Odorant-Binding Protein) Sensing in Adelphocoris lineolatus Based on Peptide Nucleic Acid and Graphene Oxide

Wenhua Tian et al. Insects. .

Abstract

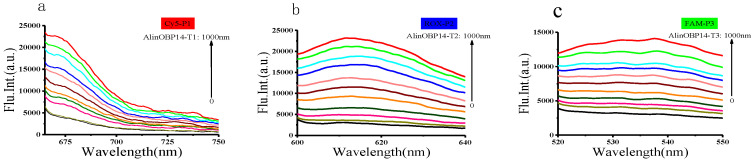
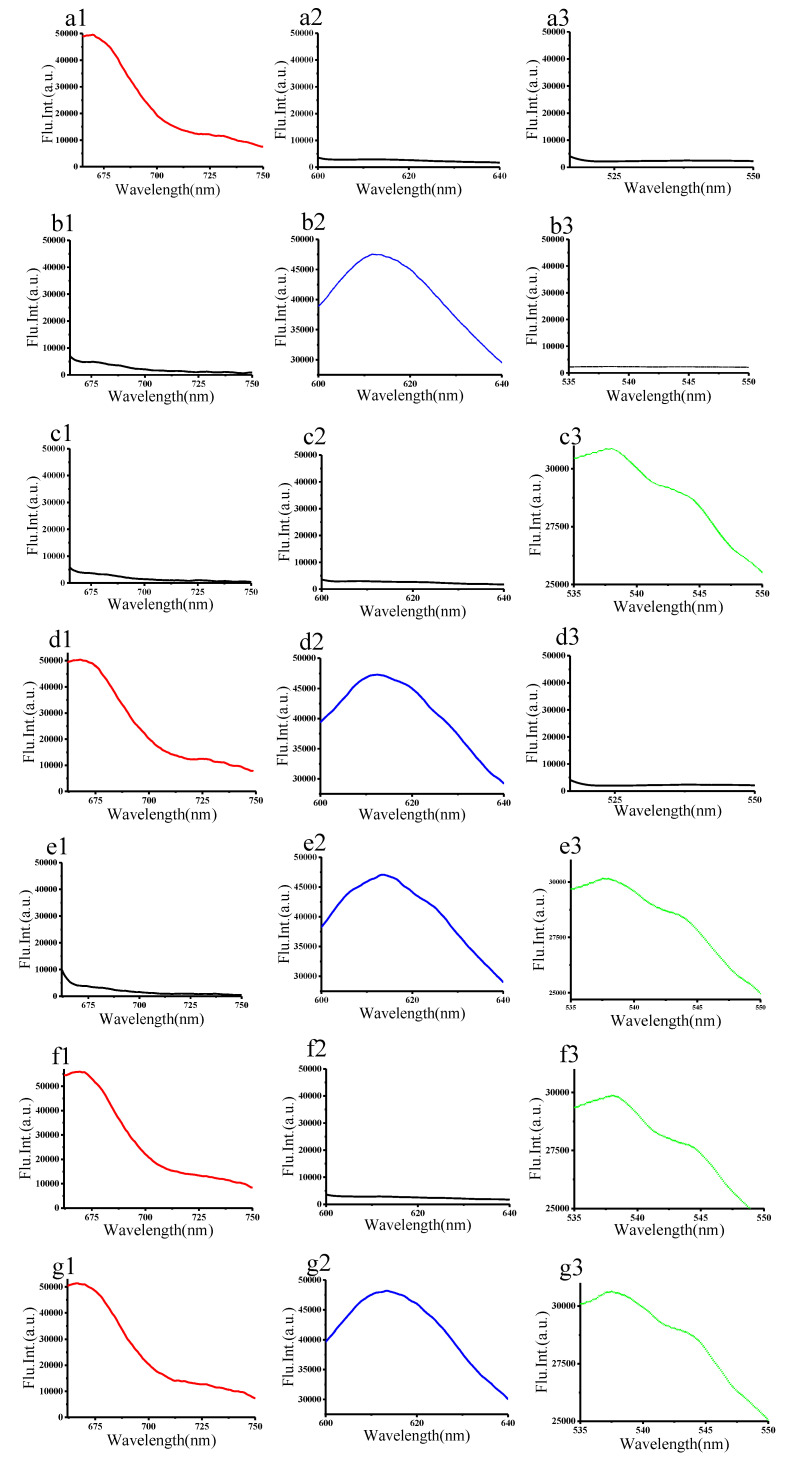
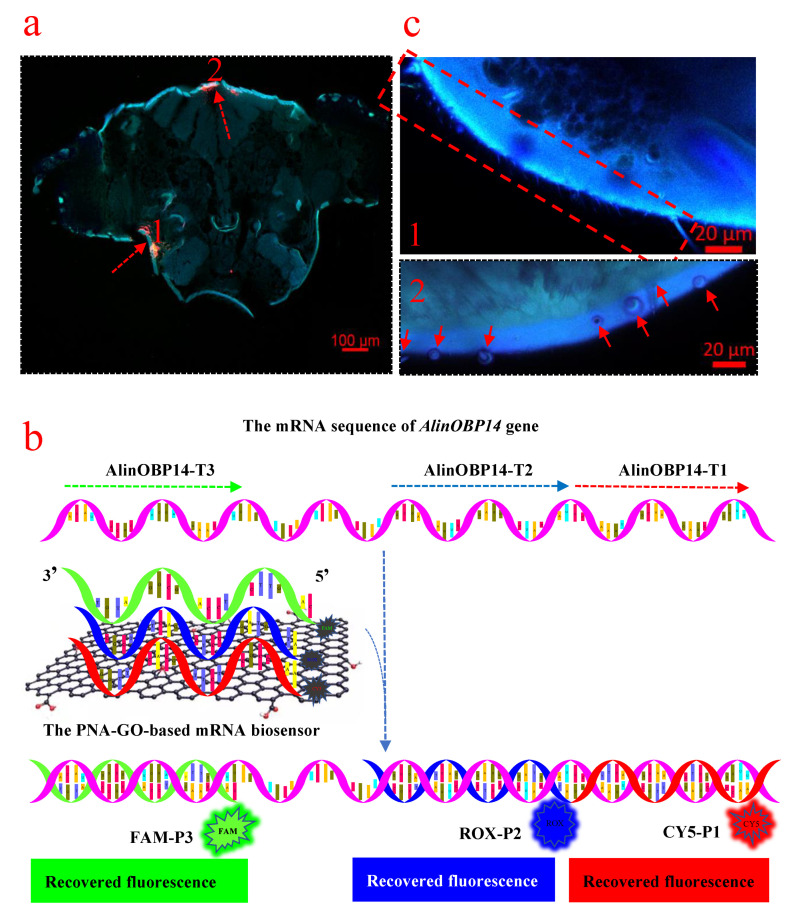
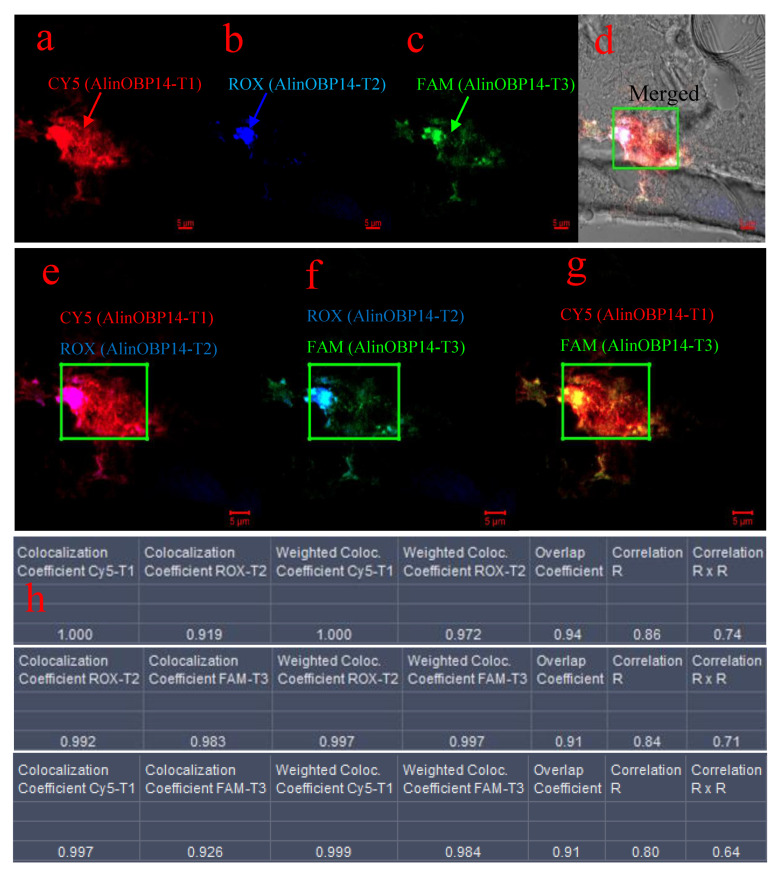
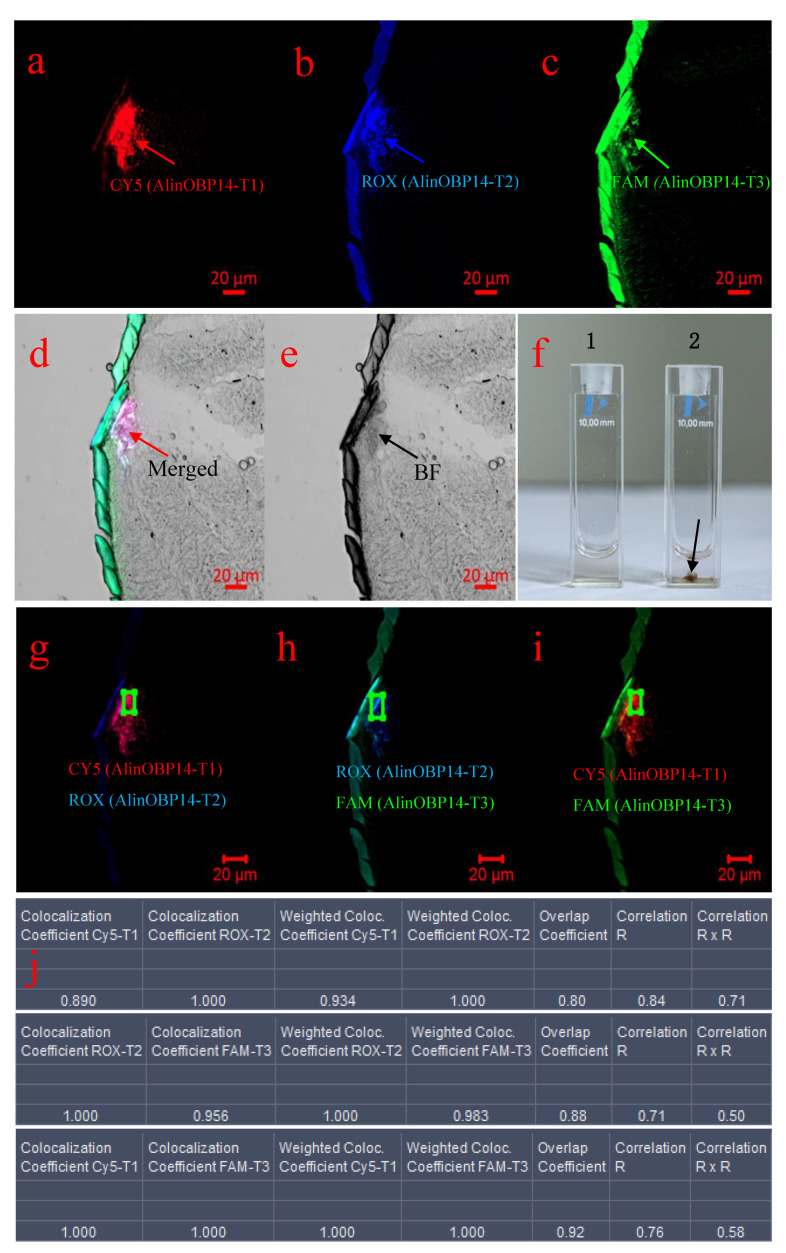
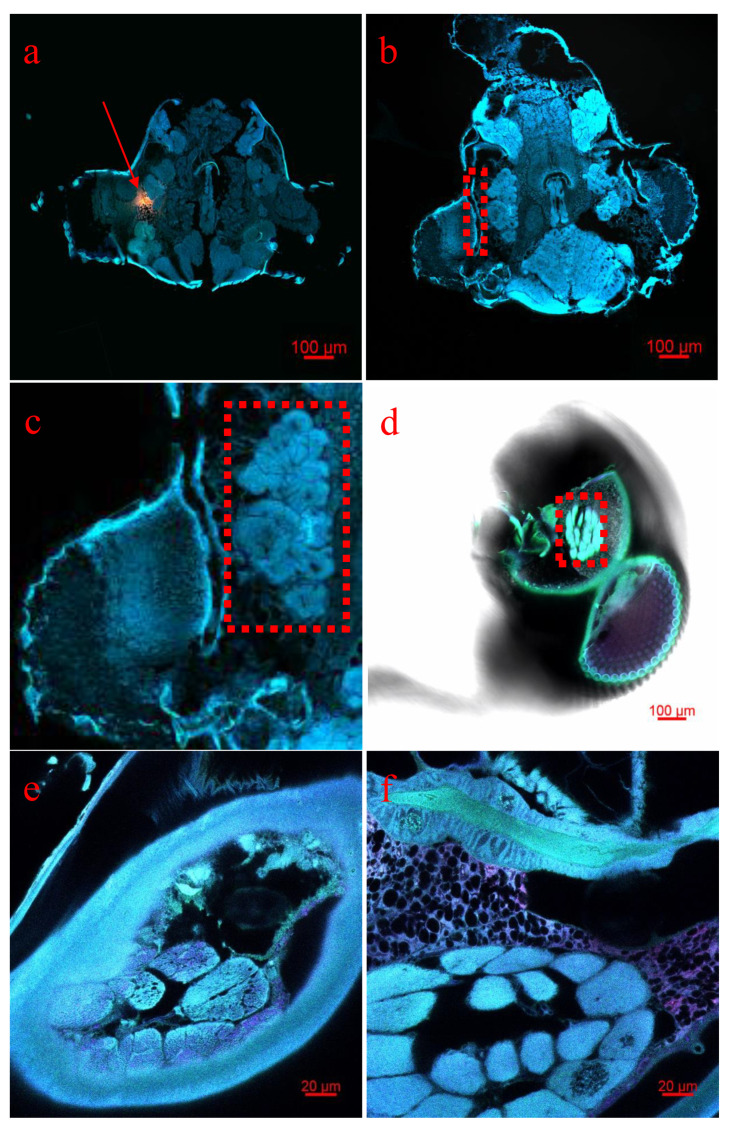
OBPs play a crucial role in the recognition of ligands and are involved in the initial steps of semiochemical perception. The diverse expression of OBP genes allows them to participate in different physiological functions in insects. In contrast to classic OBPs with typical olfactory roles in A. lineolatus, the physiological functions of Plus-C OBPs remain largely unknown. In addition, detection of the expression of insect OBP genes by conventional methods is difficult in vitro. Here, we focused on AlinOBP14, a Plus-C OBP from A. lineolatus, and we developed a PNA-GO-based mRNA biosensor to detect the expression of AlinOBP14. The results demonstrated that AlinOBP14 plays dual roles in A. lineolatus. The AlinOBP14 is expressed beneath the epidermis of the vertex and gena in heads of A. lineolatus, and it functions as a carrier for three terpenoids, while AlinOBP14 is also expressed in the peripheral antennal lobe and functions as a carrier for endogenous compounds such as precursors for juvenile hormone (JH) and JHⅢ. Our investigation provides a new method to detect the expression of OBP genes in insects, and the technique will facilitate the use of these genes as potential targets for novel insect behavioral regulation strategies against the pest.

Keywords: Adelphocoris lineolatus; AlinOBP14; Plus-C OBPs; graphene oxide (GO); in vitro; in vivo; juvenile hormone; mRNA biosensor; peptide nucleic acid (PNA); terpenoids.


Conflict of interest statement

The authors declare no conflict of interest.

Figures

Figure 1
Figure 1
The PNA-GO-based nanocomplex solution (mRNA biosensor) was mixed with chemically synthesized targets of various concentrations (0–1000 nM). The fluorescence signals intensified as the concentration of added targets increased. (a) Target mRNA: AlinOBP14-T1. The excitation wavelength was 643 nm. (b) Target mRNA: AlinOBP14-T2. The excitation wavelength was 575 nm. (c) Target mRNA: AlinOBP14-T3. The excitation wavelength was 494 nm.
Figure 2
Figure 2
The mRNA biosensor was mixed with solutions consisting of different combinations of the three targets. (a1a3) Target mRNA: AlinOBP14-T1. The excitation wavelengths were 643 nm (a1), 575 nm (a2), and 494 nm (a3), respectively. (b1b3) Target mRNA: AlinOBP14-T2. The excitation wavelengths were 643 nm (b1), 575 nm (b2), and 494 nm, (b3), separately. (c1c3) Target mRNA: AlinOBP14-T3. The excitation wavelengths were 643 nm (c1), 575 nm (c2), and 494 nm (c3), respectively. (d1d3) Target mRNA: AlinOBP14-T1 and AlinOBP14-T2. The excitation wavelengths were 643 nm (d1), 575 nm (d2), and 494 nm (d3), separately. (e1e3) Target mRNA: AlinOBP14-T2 and AlinOBP14-T3. The excitation wavelengths were 643 nm (e1), 575 nm (e2), and 494 nm (e3), respectively. (f1f3) Target mRNA: AlinOBP14-T1 and AlinOBP14-T3. The excitation wavelengths were 643 nm (f1), 575 nm (f2), and 494 nm (f3), separately. (g1g3) Target mRNA: AlinOBP14-T1, AlinOBP14-T2 and AlinOBP14-T3. The excitation wavelengths were 643 nm (g1), 575 nm (g2), and 494 nm (g3), respectively.
Figure 3
Figure 3
Simultaneous detection of three regions of target mRNA in A. lineolatus (probes: CY5-P1, ROX-P2, and FAM-P3; target mRNA: AlinOBP14-T1, AlinOBP14-T2, and AlinOBP14-T3). (a) The merged fluorescent image of three different fluorescence channels under the bright-field background showed that the fluorescence signals were intensified beneath the epidermis of the gena (the red arrow marked 1) and vertex (the red arrow marked 2) in the head of A. lineolatus (the three fluorescence dyes in the three channels were excited at 643 nm, 575 nm, 488 nm). (b) Schematic illustration of the PNA-GO-based mRNA biosensor. The fluorescence signals are recovered when the fluorescent dye-labeled probes initially adsorbed onto the surface of GO detached from GO and hybridized with complementary target mRNA. (c) The sensilla distributed at the epidermis of the gena (the red arrow marked 1) and vertex (the red arrow marked 2).
Figure 4
Figure 4
Colocalization analysis of the enhanced fluorescence signals beneath the epidermis of the gena in the head of adult A. lineolatus. (a) Excitation at 643 nm corresponding to CY5-P1 (red arrow). (b) Excitation at 575 nm corresponding to ROX-P2 (blue arrow). (c) Excitation at 488 nm corresponding to FAM-P3 (green arrow). (d) Merged image of three different fluorescence channels under a bright-field background. The green box indicates fluorescence signals that were intensified beneath the epidermis of the gena. After background correction, images were processed for colocalization analysis. (e) The spatial overlap of CY5-P1 and ROX-P2 fluorescence channels in a multichannel image. The green box indicates the area with colocalization of CY5-P1 with ROX-P2. (f) The spatial overlap of ROX-P2 and FAM-P3 fluorescence channels in a multichannel image. The green box indicates the area with colocalization of ROX-P2 with FAM-P3. (g) The spatial overlap of CY5-P1 and FAM-P3 fluorescence channels in a multichannel image. The green box indicates the area with colocalization of CY5-P1 with FAM-P3. (h) The values of coefficients calculated on images for CY5-P1 and ROX-P2, ROX-P2 and FAM-P3, and CY5-P1 and FAM-P3. The scale bar indicates 5 µm (ag).
Figure 5
Figure 5
Colocalization analysis of the enhanced fluorescence signals beneath the epidermis of the vertex in the head of adult A. lineolatus. (a) Excitation at 643 nm corresponding to CY5-P1 (red arrow). (b) Excitation at 575 nm corresponding to ROX-P2 (blue arrow). (c) Excitation at 488nm corresponding to FAM-P3 (green arrow). (d) Merged image of three different fluorescence channels under a bright-field background showing that the fluorescence signals were intensified beneath the epidermis of the vertex (red arrow). (e) A bright-field image of the epidermis of the vertex (black arrow). (f) 1 indicates that the solution of PNA-GO-based mRNA biosensor. 2 indicates that the solution of PNA-GO-based mRNA biosensor was mixed with chemically synthesized targets (AlinOBP-T1, AlinOBP-T2, and AlinOBP-T3) in vitro. The black arrow points to the aggregation of GO sheets in vitro. After background correction, images were processed for colocalization analysis. (g) The spatial overlap of CY5-P1 and ROX-P2 fluorescence channels in a multichannel image. The green box indicates the area with colocalization of CY5-P1 with ROX-P2. (h) The spatial overlap of ROX-P2 and FAM-P3 fluorescence channels in a multichannel image. The green box indicates the area with colocalization of ROX-P2 with FAM-P3. (i) The spatial overlap of CY5-P1 and FAM-P3 fluorescence channels in a multichannel image. The green box indicates the area with colocalization of CY5-P1 with FAM-P3. (j) The values of coefficients calculated using images for CY5-P1 and ROX-P2, ROX-P2 and FAM-P3, and CY5-P1 and FAM-P3, respectively. The scale bar indicates 20 µm (ae, gi).
Figure 6
Figure 6
The analysis of the enhanced fluorescence signals in the peripheral antennal lobe. (a) The merged fluorescent image of three different fluorescence channels under the bright-field background showed that the fluorescence signals were intensified in the peripheral antenna lobe (The three fluorescence dyes in three channels were excited at 643 nm, 575 nm, 488 nm). The red arrow points to fluorescent signals of PNA probes. The scale bar indicates 100 μm. (b) Non-injected A. lineolatus adults were used as a control. The red box indicates the peripheral of antennal lobe. The scale bar indicates 100 μm. (c) The antennal lobe of A. lineolatus in Fig 6b was amplified. (d) After the whole body of A. lineolatus adults were following PEGASOS recirculation procedure, the antennal lobe in the head of A. lineolatus was observed using a Zeiss LSM 880 confocal microscope (10×). The scale bar indicates 100 μm. (ef) Different layers of the antennal lobe observed under using a Zeiss LSM 880 confocal microscope (63×). The scale bar indicates 20 μm.

Similar articles

Cited by

References

    1. Hansson B.S., Stensmyr M.C. Evolution of Insect Olfaction. Neuron. 2011;72:698–711. doi: 10.1016/j.neuron.2011.11.003. - DOI - PubMed
    1. Sato K., Touhara K. Insect olfaction: Receptors, signal transduction, and behavior. Results Probl. Cell Differ. 2008;47:121–138. doi: 10.1007/400_2008_10. - DOI - PubMed
    1. Field L.M., Pickett J.A., Wadhams L.J. Molecular studies in insect olfaction. Insect Mol. Biol. 2000;9:545–551. doi: 10.1046/j.1365-2583.2000.00221.x. - DOI - PubMed
    1. Fan J., Francis F., Liu Y., Chen J.L., Cheng D.F. An overview of odorant-binding protein functions in insect peripheral olfactory reception. Genet. Mol. Res. 2011;10:3056–3069. doi: 10.4238/2011.December.8.2. - DOI - PubMed
    1. Brito N.F., Moreira M.F., Melo A.C.A. A look inside odorant-binding proteins in insect chemoreception. J. Insect Physiol. 2016;95:51–65. doi: 10.1016/j.jinsphys.2016.09.008. - DOI - PubMed

LinkOut - more resources