. 2021 May 7;13(9):2239.
doi: 10.3390/cancers13092239.

Metronomic Chemotherapy Modulates Clonal Interactions to Prevent Drug Resistance in Non-Small Cell Lung Cancer

Affiliations

Metronomic Chemotherapy Modulates Clonal Interactions to Prevent Drug Resistance in Non-Small Cell Lung Cancer

Maryna Bondarenko et al. Cancers (Basel). .

Abstract

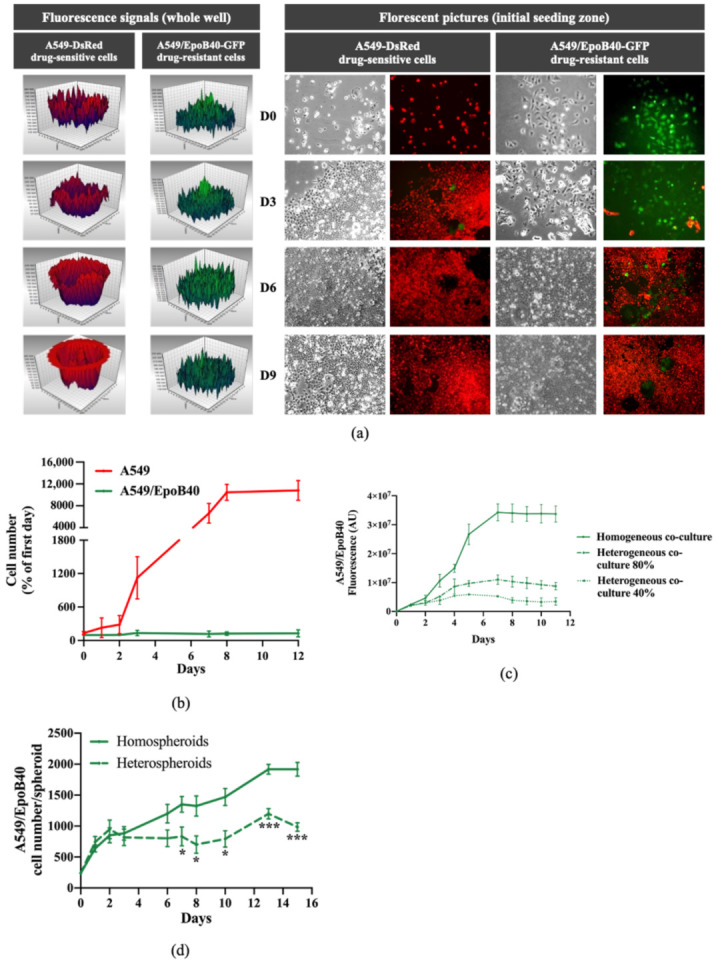
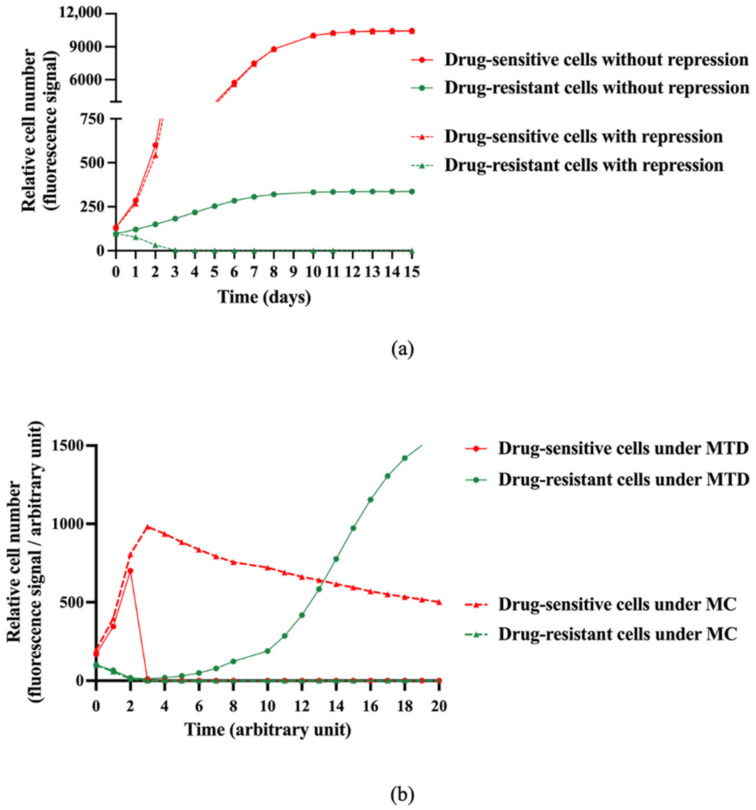
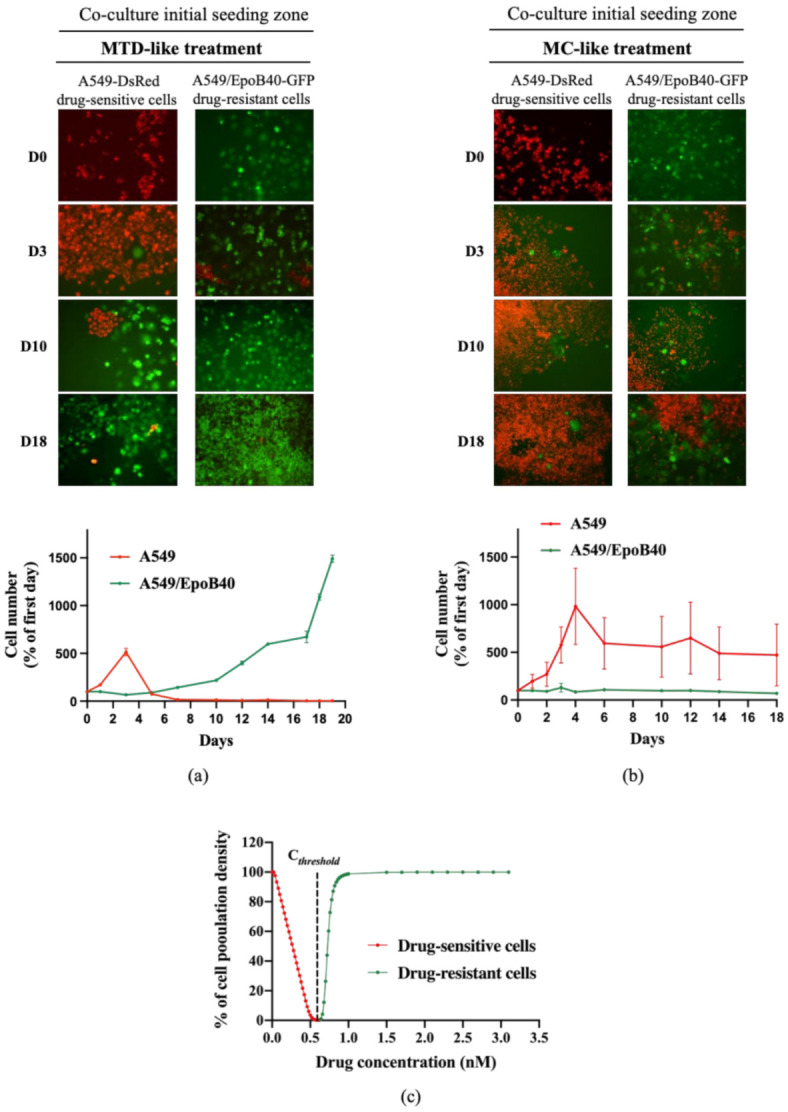
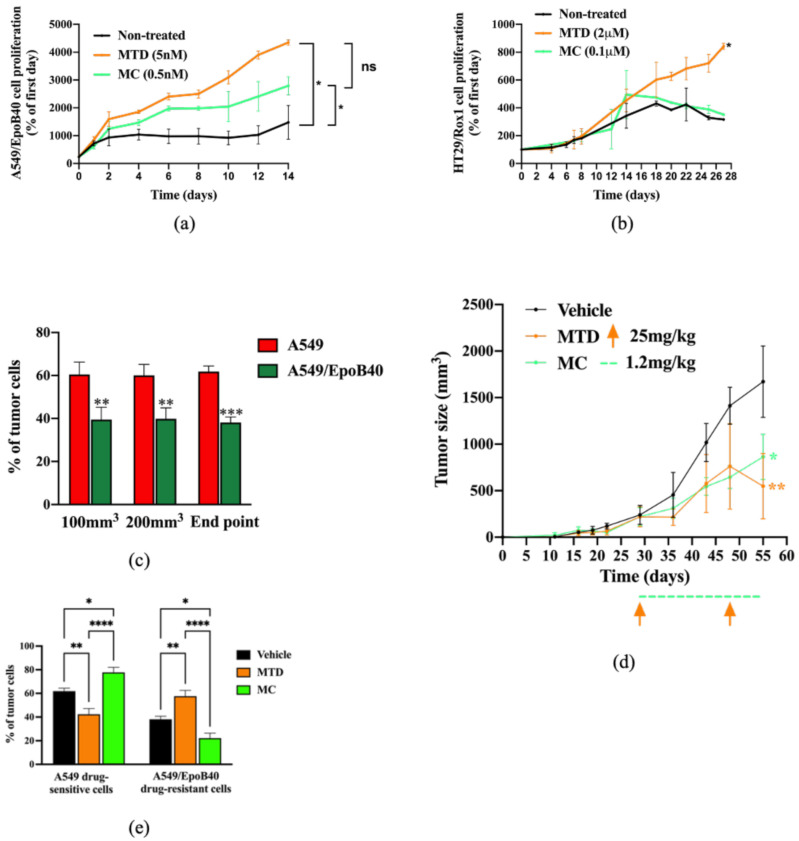
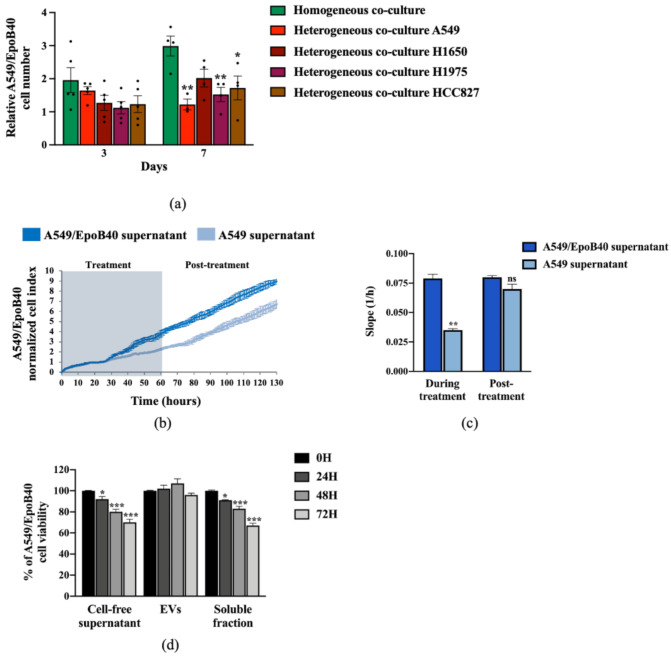
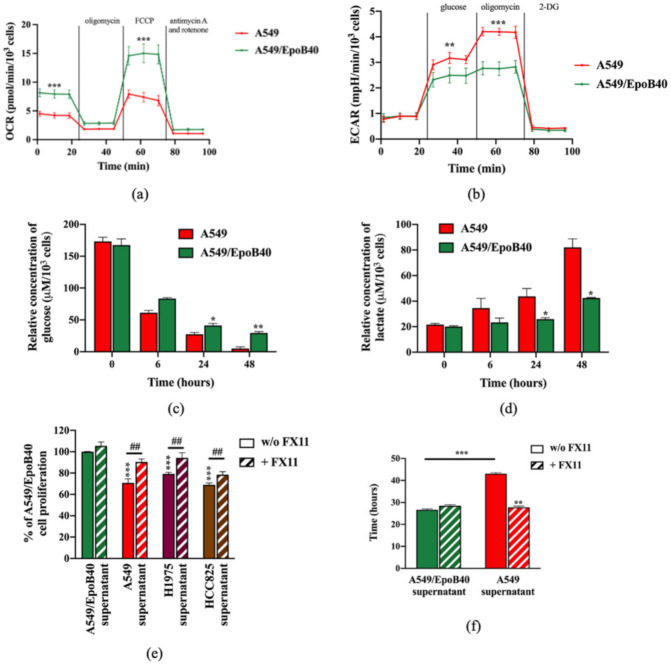
Despite recent advances in deciphering cancer drug resistance mechanisms, relapse is a widely observed phenomenon in advanced cancers, mainly due to intratumor clonal heterogeneity. How tumor clones progress and impact each other remains elusive. In this study, we developed 2D and 3D non-small cell lung cancer co-culture systems and defined a phenomenological mathematical model to better understand clone dynamics. Our results demonstrated that the drug-sensitive clones inhibit the proliferation of the drug-resistant ones under untreated conditions. Model predictions and their experimental in vitro and in vivo validations indicated that a metronomic schedule leads to a better regulation of tumor cell heterogeneity over time than a maximum-tolerated dose schedule, while achieving control of tumor progression. We finally showed that drug-sensitive and -resistant clones exhibited different metabolic statuses that could be involved in controlling the intratumor heterogeneity dynamics. Our data suggested that the glycolytic activity of drug-sensitive clones could play a major role in inhibiting the drug-resistant clone proliferation. Altogether, these computational and experimental approaches provide foundations for using metronomic therapy to control drug-sensitive and -resistant clone balance and highlight the potential of targeting cell metabolism to manage intratumor heterogeneity.

Keywords: glycolytic activity; intratumor heterogeneity; lactate dehydrogenase; mathematical modeling; metronomic chemotherapy; non-small cell lung cancer.


Conflict of interest statement

The authors declare no conflict of interest.

Figures

Figure 1
Figure 1
Drug-sensitive A549 clones inhibit the proliferation of the drug-resistant A549/EpoB40 clones. (a) Representative fluorescent signal using a well-scanning mode microplate reader (left panel) and microscopic pictures (right panel; magnification factor ×10) of A549-DsRed drug-sensitive and A549/EpoB40-GFP drug-resistant cells over time. (b) Cell number of A549 and A549/EpoB40 by recording fluorescent signals (DsRed and GFP) over time. Data were expressed as a percentage of cell number from day 0. (c) Fluorescent signal of A549/EpoB40 cells over time in homogeneous or heterogeneous 2D co-culture systems. (d) Relative A549/EpoB40 cell numbers in 3D hetero-spheroids and homo-spheroids measured by fluorescent signal over time. Data are shown as mean ± SEM. * p < 0.05; *** p < 0.001.
Figure 2
Figure 2
Model-based in silico simulation of the interaction between sensitive and resistant clones with or without treatment. (a) Model-based in silico simulations of relative drug-sensitive and drug-resistant cell proliferation over time with or without a repressive effect exerted by the drug-sensitive cells over the drug-resistant ones. (b) In silico simulations of relative drug-sensitive and drug-resistant cell proliferation under MTD (Maximum Tolerated Dose) and MC (Metronomic Chemotherapy) schedules and taking into account the suppressive effect of the drug-sensitive cells over the drug-resistant ones (β > 0 in the model).
Figure 3
Figure 3
The metronomic schedule prevents the selection of drug-resistant clones in 2D NSCLC co-culture models. (a,b) Representative fluorescent pictures of A549-DsRed drug-sensitive cells and A549/EpoB40-GFP drug-resistant cells (magnification factor ×10) over time under MTD-like treatment (a) or MC-like treatment (b). Cell number of A549 and A549/EpoB40 by recording fluorescent signals (DsRed and GFP) over time under MTD- and MC-like treatments is also represented. Data were expressed as a percentage of cell number from day 0. (c) Percentage of the carrying capacity of the well occupied by cell populations after a 30-day in silico experiment depending on the drug concentration. Red: the well was mainly filled with drug-sensitive cells at the end of the experiment, and green: the well was mainly filled with drug-resistant cells at the end of the experiment.
Figure 4
Figure 4
Biological validation of the mathematical model predictions in 3D spheroid and in vivo models. (a,b) Cell proliferation of A549/EpoB40 (a) and HT29/rox1 (b) drug-resistant cells by recording fluorescent signals over time under MTD (patupilone 5 nM (a) or oxaliplatin 2 μM (b)) or MC (patupilone 0.5 nM (a) or oxaliplatin 0.1 μM (b)) schedules. Data were expressed as a percentage of cell proliferation from day 0. (c) Ex vivo tumor cell composition at three different time points in the untreated condition. Fluorescent cell signals were quantified by flow cytometry. (d) Tumor sizes were measured over time in the untreated condition as well as under MTD (paclitaxel at 25 mg/kg, once every 3 weeks) and MC treatment (paclitaxel 1.2 mg/kg, daily). Significant differences compared to vehicle were observed. Orange arrows represent MTD-drug administration, while the dotted green line indicates the MC-drug administration period. (e) Ex vivo tumor cell composition at the end point in the untreated condition and following MTD-like and MC-like treatment schedules. Fluorescent cell signals were quantified by flow cytometry. Data are expressed as a percentage of drug-sensitive and drug-resistant cell populations and are shown as mean ± SEM. * p; ** p < 0.01; *** p < 0.001; **** p < 0.0001.
Figure 5
Figure 5
Drug-sensitive A549 clones control the proliferation of drug-resistant A549/EpoB40 clones through a paracrine pathway, independently of exosome secretion. (a) Relative quantification of A549/EpoB40 cell number in homogeneous (A549/EpoB40 only) and heterogeneous (A549/EpoB40 with either A549, H1650, H1975 or HCC827) co-culture Transwell®. Cells were stained with crystal violet at indicated times. Data were expressed as a ratio of the cell number from day 0. (b) A549/EpoB40 cell growth was studied by a real-time impedance-based method. Twenty-four hours after seeding, A549/EpoB40 cells were treated daily with cell-free supernatants from A549 cultures and from A549/EpoB40 cultures that were used as control. Measurements were performed every 15 min. Cell index values were normalized to 24 h, corresponding to the first measurement after starting treatment. The grey-shaded area indicates the duration of treatment. (c) Slopes were determined during the period of 48h supernatant treatment and 48h post-supernatant treatment. (d) Cell proliferation of A549/EpoB40 cells measured by crystal violet assay after a 0, 24, 48 and 72 h exposition to total cell-free supernatant, extracellular vesicles (EVs) or soluble fraction from A549 cultures. Results were expressed as a percentage of viability at T0. Data are shown as means ± SEM. ns > 0.05; * p < 0.05; ** p < 0.01; *** p < 0.001.
Figure 6
Figure 6
Drug-sensitive A549 clones have a higher glycolytic profile than drug-resistant A549/EpoB40 clones. (a,b) A549 and A549/EpoB40 cells were analyzed for (a) mitochondrial bioenergetics and (b) glycolysis using the Seahorse XF technology (OCR: Oxygen Consumption Rate and ECAR: ExtraCellular Acidification Rate). (c,d) Supernatants from A549 and A549/EpoB40 were collected over time and analyzed for (c) glucose consumption and (d) lactate production by using the YSI 2900 instrument. (e) A549/EpoB40 cell proliferation was measured by crystal violet assay at 72 h after daily exposition to cell-free supernatants from A549, H1975 or HCC825 cultures previously incubated with or without 3 µM of FX11. Supernatants from A549/EpoB40 cultures that were subjected to the same treatment were used as a control. Results were expressed as a percentage of control cell proliferation. (f) A549/EpoB40 cell growth was followed by a real-time impedance-based method. A549/EpoB40 cells were exposed daily to cell-free supernatants from A549 and A549/EpoB40 cultures that were previously incubated with or without 3 µM of FX11. Doubling time of A549/EpoB40 cells was calculated in different conditions. Data are shown as means ± SEM. * p < 0.05; ** p < 0.01; *** p < 0.001; ## p < 0.01 (* comparison to A549/EpoB40 supernatant w/o FX11 and # comparison between w/o FX11 and FX11 treated conditions).

References

    1. Greaves M., Maley C.C. Clonal evolution in cancer. Nature. 2012;481:306–313. doi: 10.1038/nature10762. - DOI - PMC - PubMed
    1. Marusyk A., Almendro V., Polyak K. Intra-tumour heterogeneity: A looking glass for cancer? Nat. Rev. Cancer. 2012;12:323–334. doi: 10.1038/nrc3261. - DOI - PubMed
    1. Dagogo-Jack I., Shaw A.T. Tumour heterogeneity and resistance to cancer therapies. Nat. Rev. Clin. Oncol. 2018;15:81–94. doi: 10.1038/nrclinonc.2017.166. - DOI - PubMed
    1. Swanton C. Intratumor heterogeneity: Evolution through space and time. Cancer Res. 2012;72:4875–4882. doi: 10.1158/0008-5472.CAN-12-2217. - DOI - PMC - PubMed
    1. Gatenby R.A. A change of strategy in the war on cancer. Nature. 2009;459:508–509. doi: 10.1038/459508a. - DOI - PubMed