

Development of a Prototype Lateral Flow Immunoassay of Cortisol in Saliva for Daily Monitoring of Stress
- PMID: 34067188
- PMCID: PMC8151953
- DOI: 10.3390/bios11050146
Development of a Prototype Lateral Flow Immunoassay of Cortisol in Saliva for Daily Monitoring of Stress
Abstract
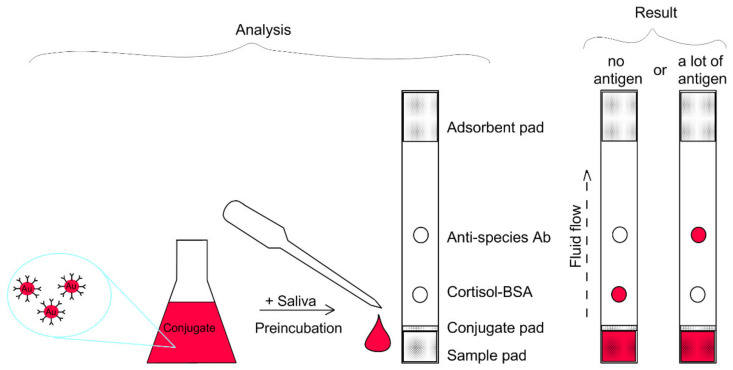
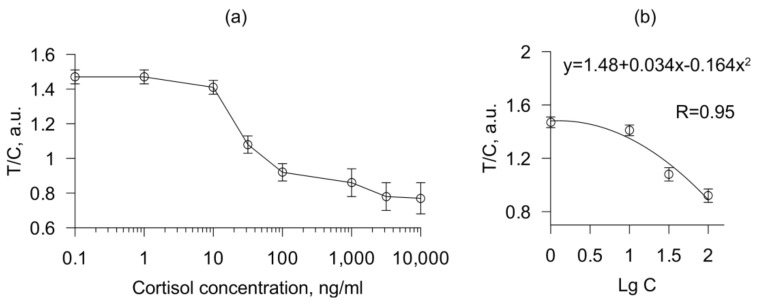
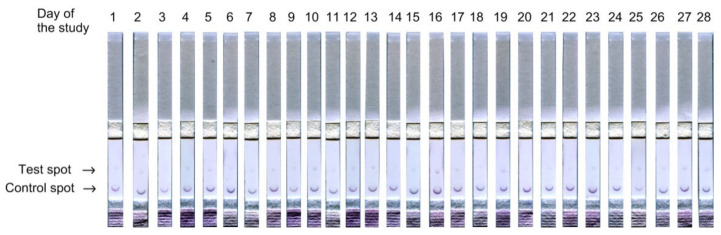
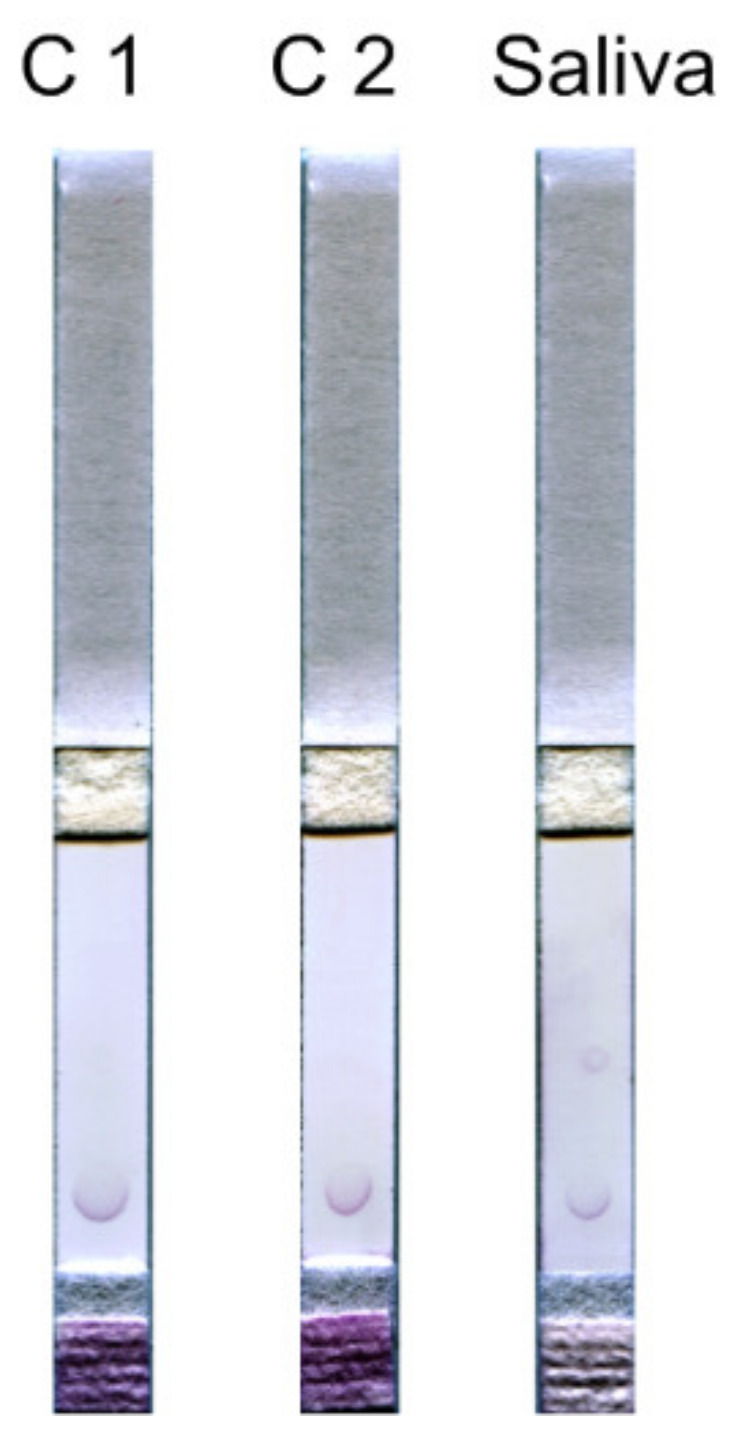
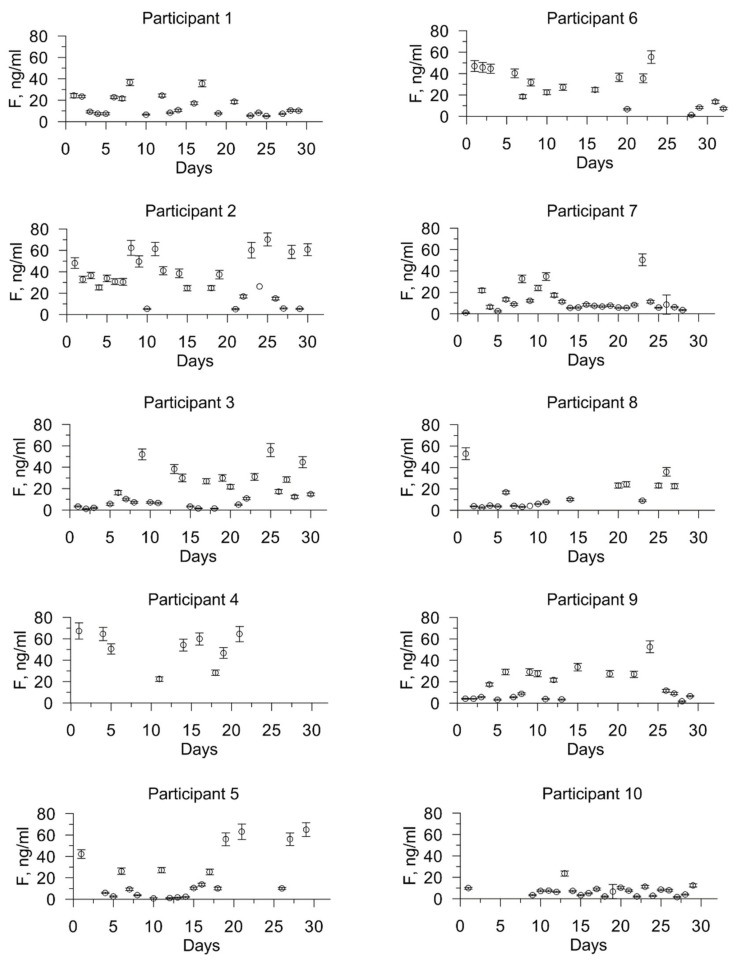
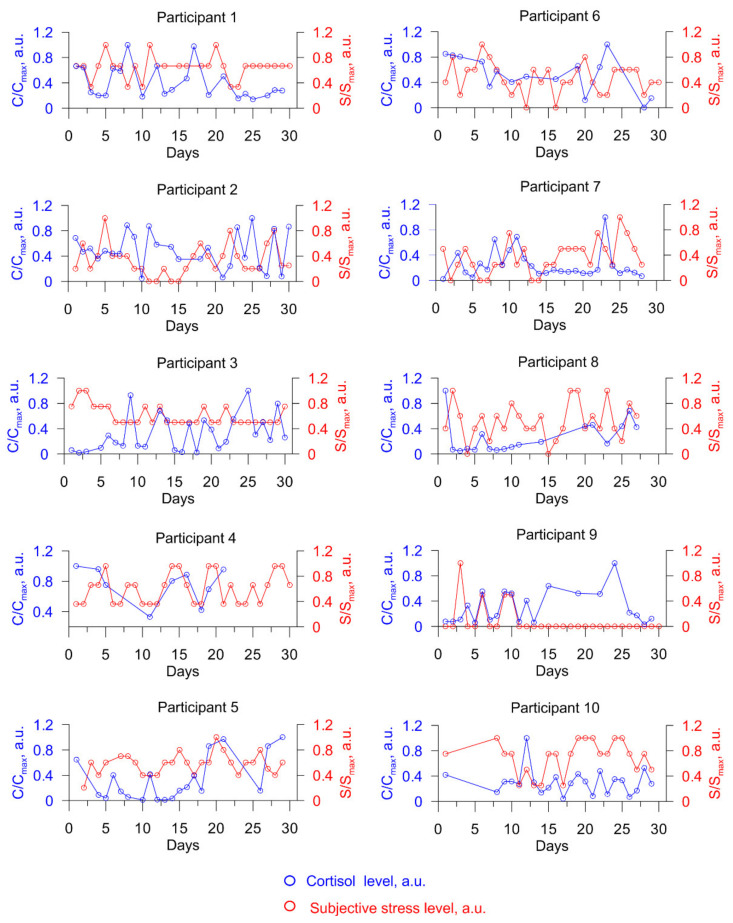
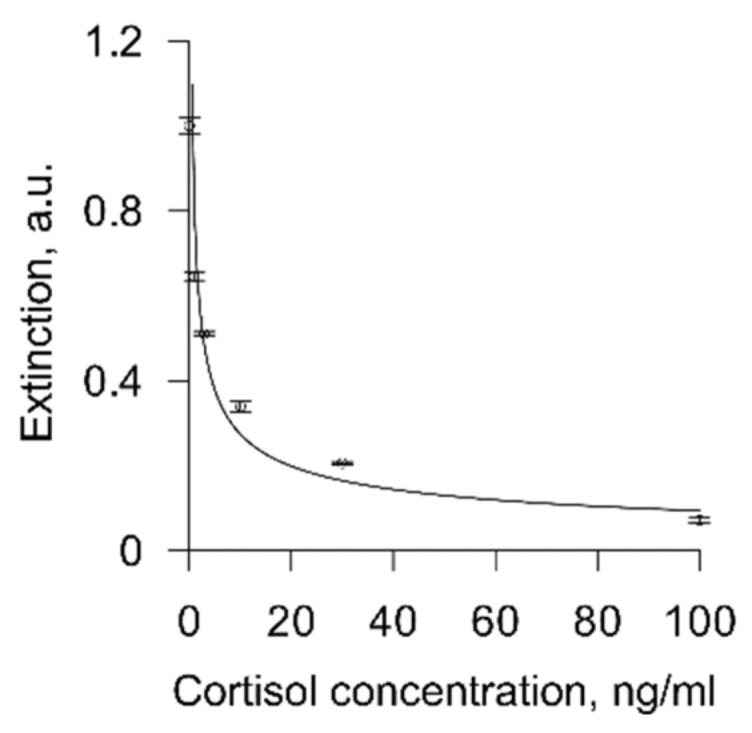
Emotional stress negatively affects the quality of a person's daily life. From a physiological point of view, stress is expressed in the excitation of the hypothalamic-pituitary-adrenal cortex axis, which leads to the release of the hormone cortisol into the blood. We developed a lateral flow immunoassay to detect cortisol in human salivary fluid and tested it on 10 healthy volunteers daily for about one month (n = 293 saliva samples). Cortisol was detected in concentrations ranging from 1 to 70 ng/mL. Salivary cortisol levels were confirmed by ELISA. The straightness range of LFIA calibration was from 1 to 100 ng/mL. The diagnostic sensitivity of the method was 73%. It was found that in 3 out of 10 subjects, fluctuations in the level of cortisol in saliva partially corresponded to the subjectively assessed level of stress.
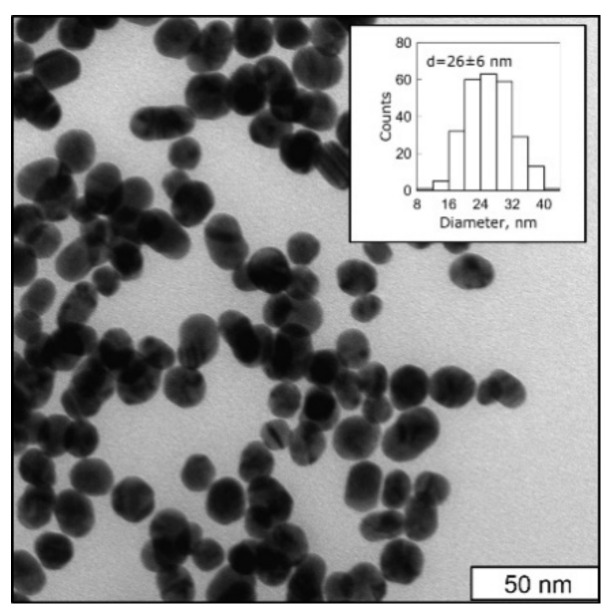
Keywords: emotional stress; gold nanoparticles conjugation; immunochromatographic test; point-of-care testing; rapid detection; salivatory cortisol.
Conflict of interest statement
The author declares no conflict of interest.
Figures
Similar articles
-
Salivary cortisol and cortisone in the clinical setting.Curr Opin Endocrinol Diabetes Obes. 2017 Jun;24(3):161-168. doi: 10.1097/MED.0000000000000328. Curr Opin Endocrinol Diabetes Obes. 2017. PMID: 28375882 Review.
-
Plasma, salivary and urinary cortisol levels following physiological and stress doses of hydrocortisone in normal volunteers.BMC Endocr Disord. 2014 Nov 26;14:91. doi: 10.1186/1472-6823-14-91. BMC Endocr Disord. 2014. PMID: 25425285 Free PMC article.
-
Validation of a qualitative immunochromatographic test for the noninvasive assessment of stress in dogs.J Chromatogr B Analyt Technol Biomed Life Sci. 2016 Aug 15;1028:192-198. doi: 10.1016/j.jchromb.2016.06.019. Epub 2016 Jun 16. J Chromatogr B Analyt Technol Biomed Life Sci. 2016. PMID: 27367309
-
Salivary cortisol as a diagnostic tool for Cushing's syndrome and adrenal insufficiency: improved screening by an automatic immunoassay.Eur J Endocrinol. 2012 Apr;166(4):613-8. doi: 10.1530/EJE-11-0945. Epub 2012 Jan 3. Eur J Endocrinol. 2012. PMID: 22214924 Clinical Trial.
-
Utility of salivary cortisol measurements in Cushing's syndrome and adrenal insufficiency.J Clin Endocrinol Metab. 2009 Oct;94(10):3647-55. doi: 10.1210/jc.2009-1166. Epub 2009 Jul 14. J Clin Endocrinol Metab. 2009. PMID: 19602555 Review.
Cited by
-
An Immunosensor for the Determination of Cortisol in Serum and Saliva by Array SPRi.Sensors (Basel). 2022 Dec 10;22(24):9675. doi: 10.3390/s22249675. Sensors (Basel). 2022. PMID: 36560051 Free PMC article.
-
Thermally Responsive Alkane Partitions for Assay Automation.ACS Appl Mater Interfaces. 2022 Feb 23;14(7):8865-8875. doi: 10.1021/acsami.2c00493. Epub 2022 Feb 11. ACS Appl Mater Interfaces. 2022. PMID: 35147027 Free PMC article.
-
Rapid Mental Stress Evaluation Based on Non-Invasive, Wearable Cortisol Detection with the Self-Assembly of Nanomagnetic Beads.Biosensors (Basel). 2025 Feb 23;15(3):140. doi: 10.3390/bios15030140. Biosensors (Basel). 2025. PMID: 40136937 Free PMC article.
-
Coupling Capillary-Driven Microfluidics with Lateral Flow Immunoassay for Signal Enhancement.Biosensors (Basel). 2023 Aug 21;13(8):832. doi: 10.3390/bios13080832. Biosensors (Basel). 2023. PMID: 37622918 Free PMC article.
References
-
- Srisrattakarn A., Tippayawat P., Chanawong A., Tavichakorntrakool R., Daduang J., Wonglakorn L., Lulitanond A. Development of a prototype lateral flow immunoassay for rapid detection of staphylococcal protein A in positive blood culture samples. Diagnostics. 2020;10:794. doi: 10.3390/diagnostics10100794. - DOI - PMC - PubMed
-
- Khlebtsov B.N., Bratashov D.N., Byzova N.A., Dzantiev B.B., Khlebtsov N.G. SERS-based lateral flow immunoassay of troponin I by using gap-enhanced Raman tags. Nano Res. 2019;12:413–420. doi: 10.1007/s12274-018-2232-4. - DOI
-
- Byzova N.A., Zherdev A.V., Vengerov Y.Y., Starovoitova T.A., Dzantiev B.B. A triple immunochromatographic test for simultaneous determination of cardiac troponin I, fatty acid binding protein, and C-reactive protein biomarkers. Microchim. Acta. 2017;184:463–471. doi: 10.1007/s00604-016-2022-1. - DOI
MeSH terms
Substances
Grants and funding
LinkOut - more resources
Full Text Sources
