

Time-Frequency Characterization of Resting Brain in Bipolar Disorder during Euthymia-A Preliminary Study
- PMID: 34067189
- PMCID: PMC8150994
- DOI: 10.3390/brainsci11050599
Time-Frequency Characterization of Resting Brain in Bipolar Disorder during Euthymia-A Preliminary Study
Abstract
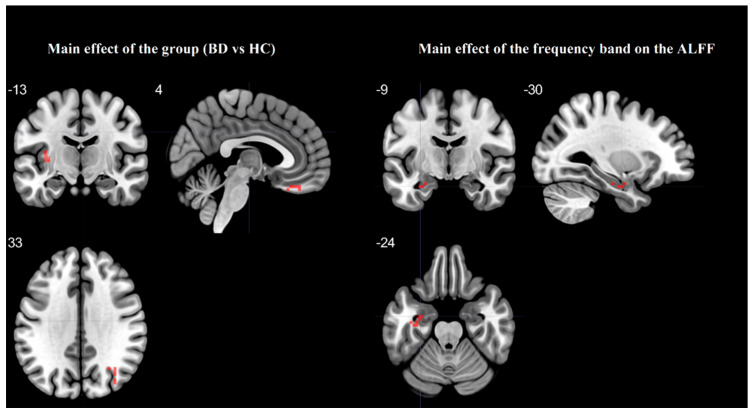
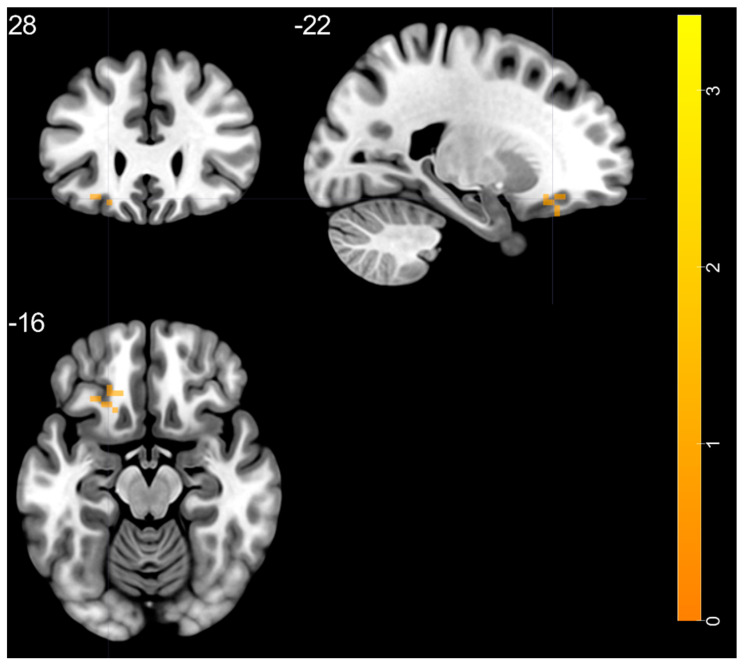
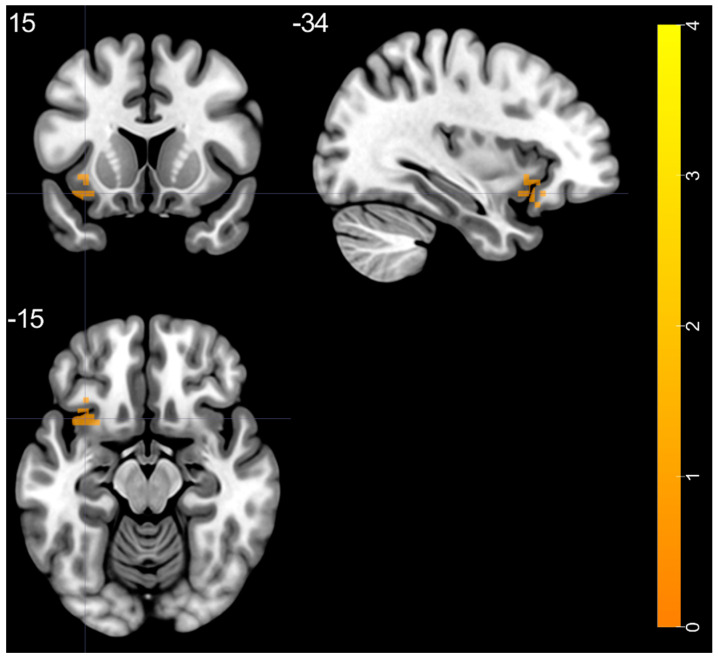
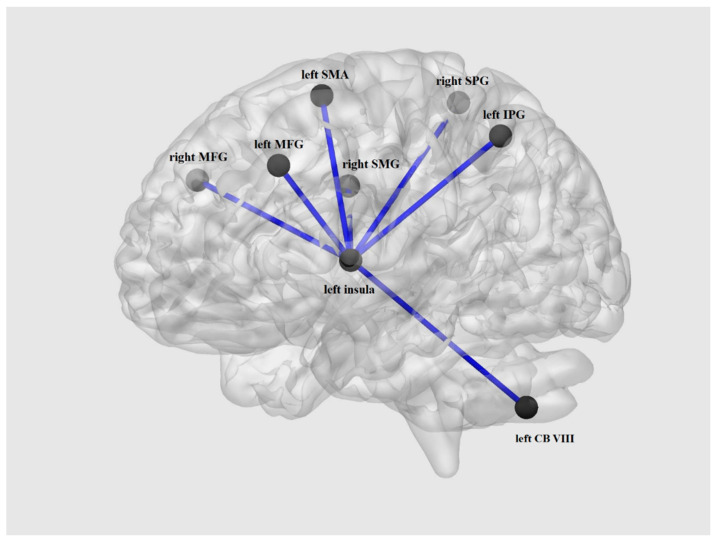
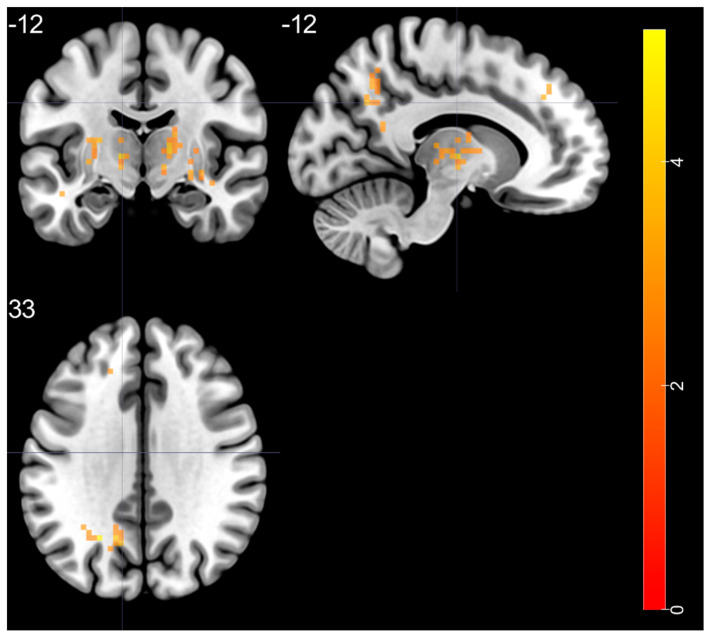
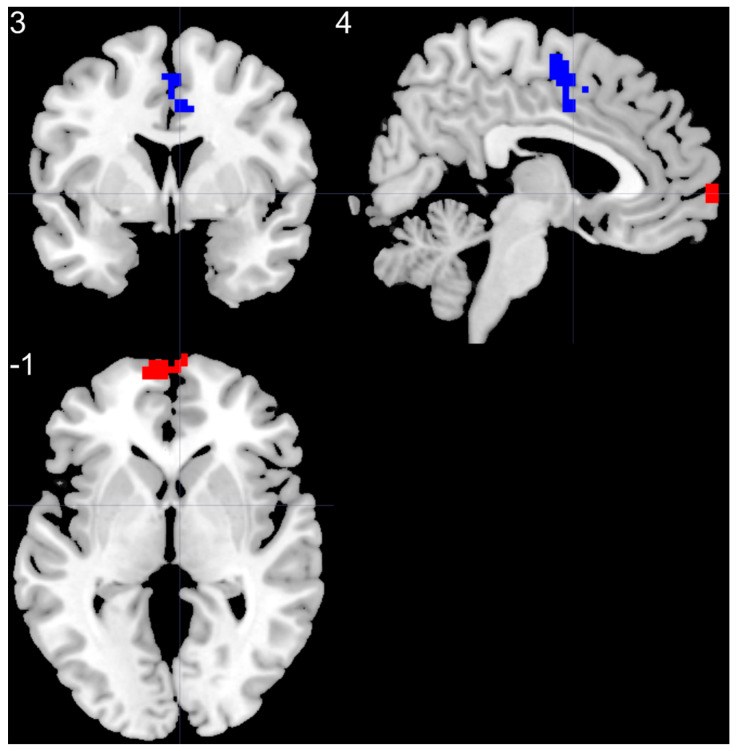
The goal of this paper is to investigate the baseline brain activity in euthymic bipolar disorder (BD) patients by comparing it to healthy controls (HC) with the use of a variety of resting state functional magnetic resonance imaging (rs-fMRI) analyses, such as amplitude of low frequency fluctuations (ALFF), fractional ALFF (f/ALFF), ALFF-based functional connectivity (FC), and r egional homogeneity (ReHo). We hypothesize that above-mentioned techniques will differentiate BD from HC indicating dissimilarities between the groups within different brain structures. Forty-two participants divided into two groups of euthymic BD patients (n = 21) and HC (n = 21) underwent rs-fMRI evaluation. Typical band ALFF, slow-4, slow-5, f/ALFF, as well as ReHo indexes were analyzed. Regions with altered ALFF were chosen as ROI for seed-to-voxel analysis of FC. As opposed to HC, BD patients revealed: increased ALFF in left insula; increased slow-5 in left middle temporal pole; increased f/ALFF in left superior frontal gyrus, left superior temporal gyrus, left middle occipital gyrus, right putamen, and bilateral thalamus. There were no significant differences between BD and HC groups in slow-4 band. Compared to HC, the BD group presented higher ReHo values in the left superior medial frontal gyrus and lower ReHo values in the right supplementary motor area. FC analysis revealed significant hyper-connectivity within the BD group between left insula and bilateral middle frontal gyrus, right superior parietal gyrus, right supramarginal gyrus, left inferior parietal gyrus, left cerebellum, and left supplementary motor area. To our best knowledge, this is the first rs-fMRI study combining ReHo, ALFF, f/ALFF, and subdivided frequency bands (slow-4 and slow-5) in euthymic BD patients. ALFF, f/ALFF, slow-5, as well as REHO analysis revealed significant differences between two studied groups. Although results obtained with the above methods enable to identify group-specific brain structures, no overlap between the brain regions was detected. This indicates that combination of foregoing rs-fMRI methods may complement each other, revealing the bigger picture of the complex resting state abnormalities in BD.
Keywords: ALFF; ReHo; affective disorders; f/ALFF; functional connectivity; insula.
Conflict of interest statement
The authors declare no conflict of interest.
Figures
References
-
- Chrobak A., Bohaterewicz B., Tereszko A., Krupa A., Sobczak A., Ceglarek A., Wielgus M., Fafrowicz M., Siwek M., Marek T., et al. Altered functional connectivity among frontal eye fields, thalamus and cerebellum in bipolar disorder. Psychiatr. Pol. 2019;133:1–11. doi: 10.12740/PP/OnlineFirst/104445. - DOI - PubMed
Grants and funding
LinkOut - more resources
Full Text Sources
Research Materials
