

Detection of Anti-Nucleocapsid Antibody in COVID-19 Patients in Bangladesh Is not Correlated with Previous Dengue Infection
- PMID: 34067281
- PMCID: PMC8224749
- DOI: 10.3390/pathogens10060637
Detection of Anti-Nucleocapsid Antibody in COVID-19 Patients in Bangladesh Is not Correlated with Previous Dengue Infection
Abstract
Background: The assessment of antibody responses to severe acute respiratory syndrome coronavirus-2 is potentially confounded by exposures to flaviviruses. The aims of the present research were to determine whether anti-dengue antibodies affect the viral load and the detection of anti-coronavirus nucleocapsid (N)-protein antibodies in coronavirus infectious disease 2019 (COVID-19) in Bangladesh.
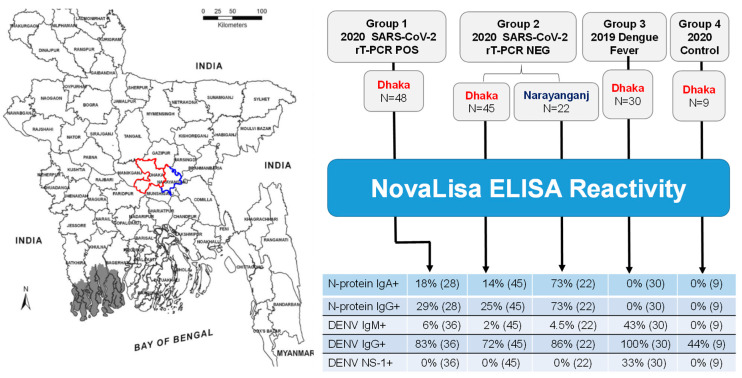
Methods: Viral RNA was evaluated in swab specimens from 115 COVID-19 patients by real-time reverse transcription polymerase chain reaction (rT-PCR). The anti-N-protein antibodies, anti-dengue virus E-protein antibodies and the dengue non-structural protein-1 were determined in serum from 115 COVID-19 patients, 30 acute dengue fever pre-COVID-19 pandemic and nine normal controls by ELISA.
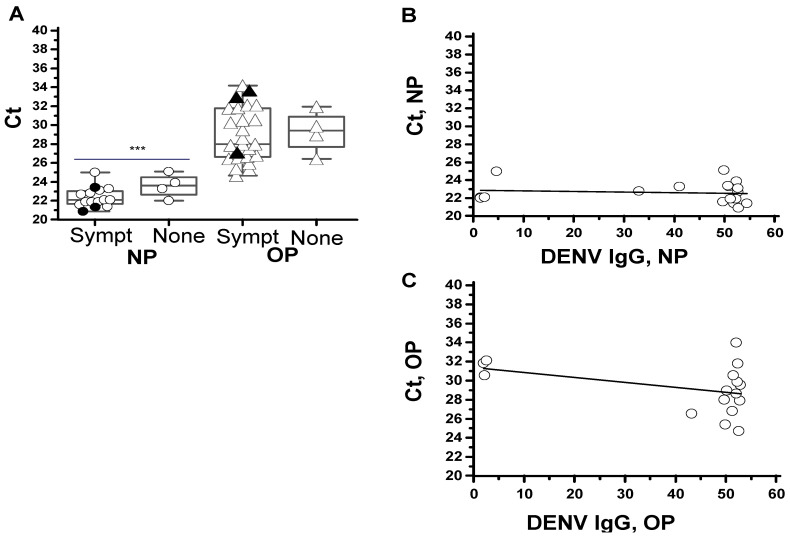
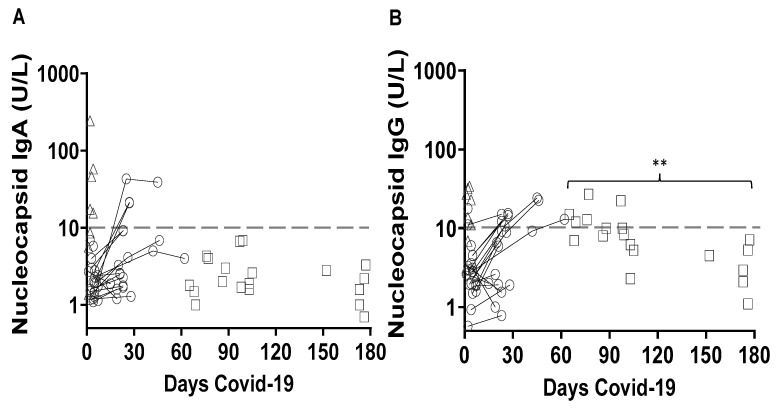
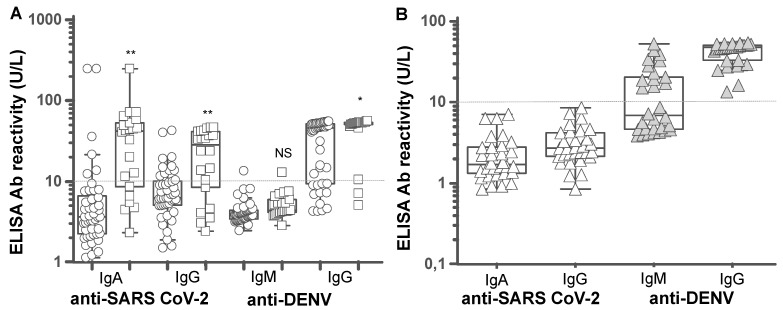
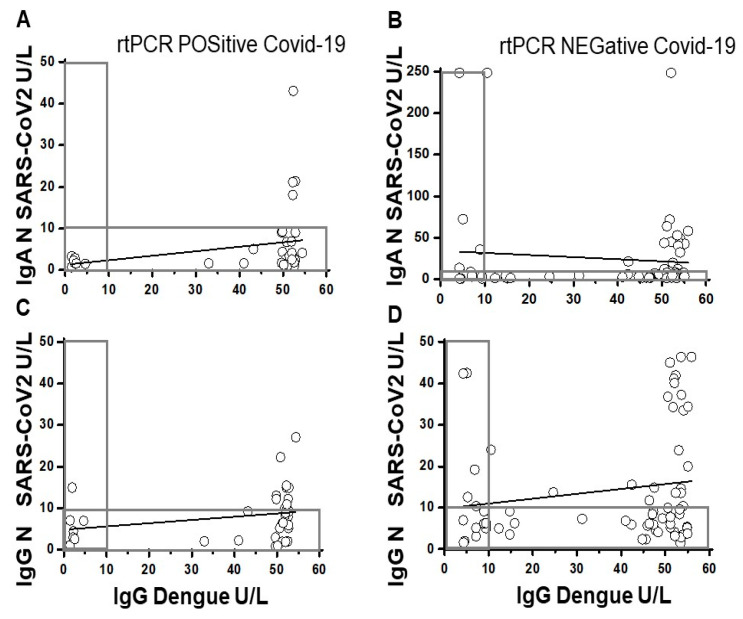
Results: The concentrations of viral RNA in the nasopharyngeal; Ct median (95% CI); 22 (21.9-23.3) was significantly higher than viral RNA concentrations in oropharyngeal swabs; and 29 (27-30.5) p < 0.0001. Viral RNA concentrations were not correlated with-dengue IgG levels. The anti-nucleocapsid antibodies were IgA 27% positive and IgG 35% positive at days 1 to 8 post-onset of COVID-19 symptoms versus IgA 0% and IgG 0% in dengue patients, p < 0.0001. The levels of anti- nucleocapsid IgA or IgG versus the levels of anti-dengue IgM or IgG revealed no significant correlations.
Conclusions: Viral RNA and anti-nucleocapsid antibodies were detected in COVID-19 patients from dengue-endemic regions of Bangladesh, independently of the dengue IgG levels.
Keywords: COVID-19; DENV; ELISA; IgA; IgG; IgM; N-protein; SARS-CoV-2; dengue fever; rT-PCR.
Conflict of interest statement
The authors do not have a commercial or other association that might pose a conflict of interest. The Elisa Kits were provided by Novatec GmbH.
Figures
Similar articles
-
Longitudinal profile of immunoglobulin G (IgG), IgM, and IgA antibodies against the severe acute respiratory syndrome (SARS) coronavirus nucleocapsid protein in patients with pneumonia due to the SARS coronavirus.Clin Diagn Lab Immunol. 2004 Jul;11(4):665-8. doi: 10.1128/CDLI.11.4.665-668.2004. Clin Diagn Lab Immunol. 2004. PMID: 15242938 Free PMC article.
-
Temporal profiles of viral load in posterior oropharyngeal saliva samples and serum antibody responses during infection by SARS-CoV-2: an observational cohort study.Lancet Infect Dis. 2020 May;20(5):565-574. doi: 10.1016/S1473-3099(20)30196-1. Epub 2020 Mar 23. Lancet Infect Dis. 2020. PMID: 32213337 Free PMC article.
-
Distinct anti-NP, anti-RBD and anti-Spike antibody profiles discriminate death from survival in COVID-19.Front Immunol. 2023 Oct 9;14:1206979. doi: 10.3389/fimmu.2023.1206979. eCollection 2023. Front Immunol. 2023. PMID: 37876932 Free PMC article.
-
Anti-Arbovirus Antibodies Cross-React With Severe Acute Respiratory Syndrome Coronavirus 2.Microbiol Spectr. 2022 Dec 21;10(6):e0263922. doi: 10.1128/spectrum.02639-22. Epub 2022 Nov 29. Microbiol Spectr. 2022. PMID: 36445096 Free PMC article.
-
[SARS-CoV-2 and Microbiological Diagnostic Dynamics in COVID-19 Pandemic].Mikrobiyol Bul. 2020 Jul;54(3):497-509. doi: 10.5578/mb.69839. Mikrobiyol Bul. 2020. PMID: 32755524 Review. Turkish.
Cited by
-
Molecular and Serological Characterization of the SARS-CoV-2 Delta Variant in Bangladesh in 2021.Viruses. 2021 Nov 19;13(11):2310. doi: 10.3390/v13112310. Viruses. 2021. PMID: 34835116 Free PMC article.
-
Dengue and COVID-19 Co-Circulation in the Peruvian Amazon: A Population-Based Study.Am J Trop Med Hyg. 2023 Apr 24;108(6):1249-1255. doi: 10.4269/ajtmh.22-0539. Print 2023 Jun 7. Am J Trop Med Hyg. 2023. PMID: 37094790 Free PMC article.
-
SARS-CoV-2 Variants and COVID-19 in Bangladesh-Lessons Learned.Viruses. 2024 Jul 4;16(7):1077. doi: 10.3390/v16071077. Viruses. 2024. PMID: 39066238 Free PMC article. Review.
-
Host Cell and SARS-CoV-2-Associated Molecular Structures and Factors as Potential Therapeutic Targets.Cells. 2021 Sep 15;10(9):2427. doi: 10.3390/cells10092427. Cells. 2021. PMID: 34572076 Free PMC article. Review.
-
Low Risk of Serological Cross-Reactivity between the Dengue Virus and SARS-CoV-2-IgG Antibodies Using Advanced Detection Assays.Intervirology. 2022;65(4):224-229. doi: 10.1159/000522479. Epub 2022 Feb 8. Intervirology. 2022. PMID: 35134813 Free PMC article.
References
-
- John Hopkins University of Medicine Coronavirus. [(accessed on 21 May 2021)]. Available online: https://coronavirus.jhu.edu/
-
- Klein S., Cortese M., Winter S.L., Waschsmuth-Melm M., Neufeldt C.J., Cerikan B., Stanifer M.L., Boulant S., Bartenschlager R., Chlanda P. SARS-CoV-2 structure and replication characterized by in situ cryo-electron tomography. Nat. Comm. 2020;11:5885–5895. doi: 10.1038/s41467-020-19619-7. - DOI - PMC - PubMed
LinkOut - more resources
Full Text Sources
Research Materials
Miscellaneous
