

Mapping of Metabolic Heterogeneity of Glioma Using MR-Spectroscopy
- PMID: 34067701
- PMCID: PMC8155922
- DOI: 10.3390/cancers13102417
Mapping of Metabolic Heterogeneity of Glioma Using MR-Spectroscopy
Abstract
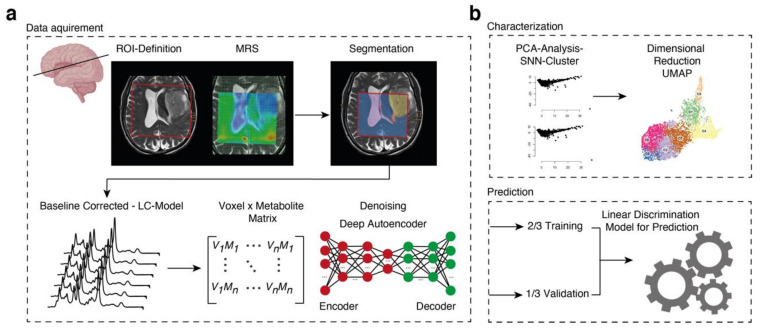
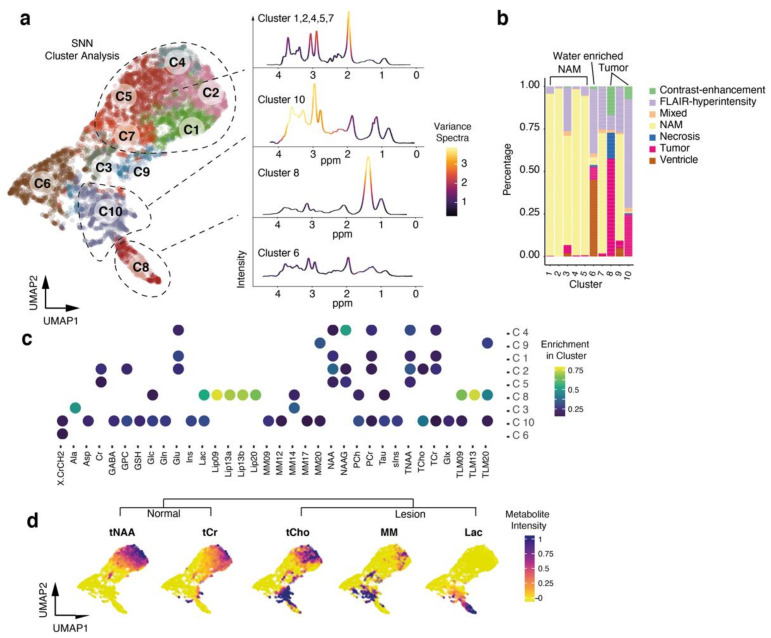
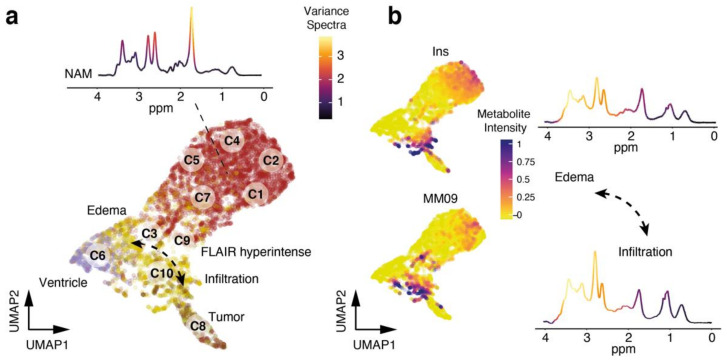
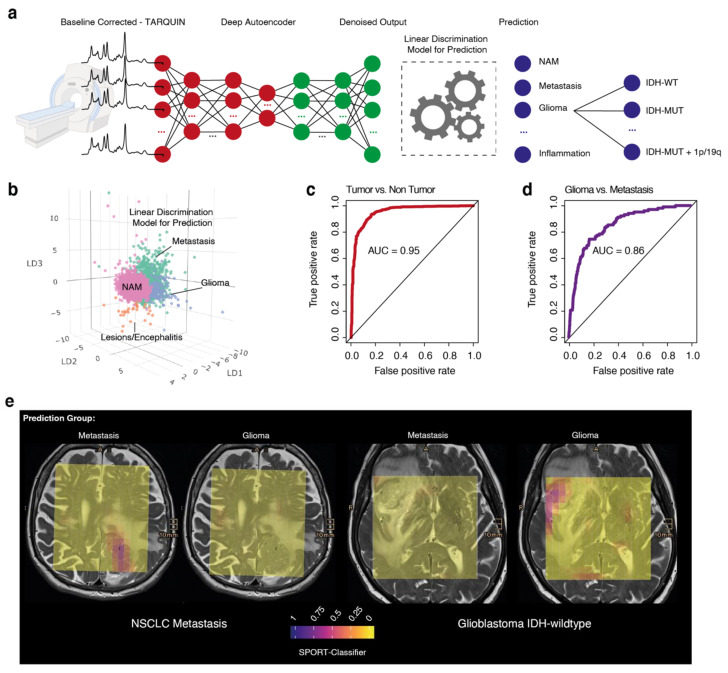
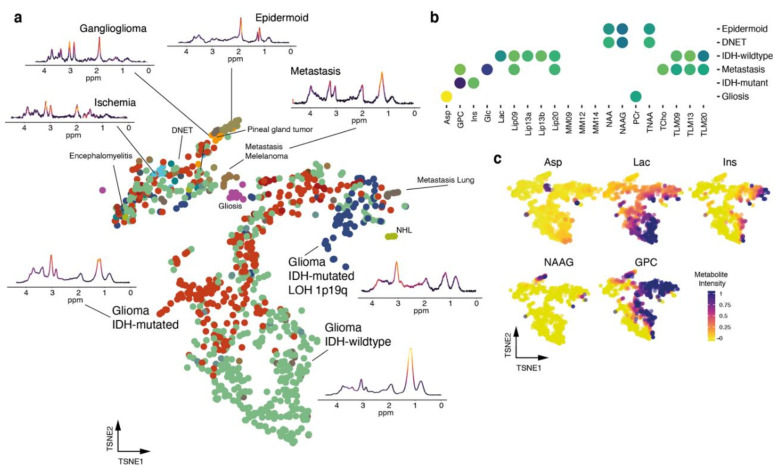
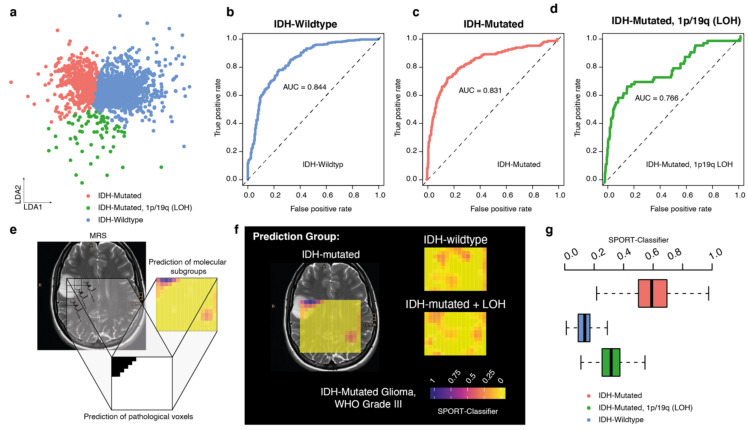
Proton magnetic resonance spectroscopy (1H-MRS) delivers information about the non-invasive metabolic landscape of brain pathologies. 1H-MRS is used in clinical setting in addition to MRI for diagnostic, prognostic and treatment response assessments, but the use of this radiological tool is not entirely widespread. The importance of developing automated analysis tools for 1H-MRS lies in the possibility of a straightforward application and simplified interpretation of metabolic and genetic data that allow for incorporation into the daily practice of a broad audience. Here, we report a prospective clinical imaging trial (DRKS00019855) which aimed to develop a novel MR-spectroscopy-based algorithm for in-depth characterization of brain lesions and prediction of molecular traits. Dimensional reduction of metabolic profiles demonstrated distinct patterns throughout pathologies. We combined a deep autoencoder and multi-layer linear discriminant models for voxel-wise prediction of the molecular profile based on MRS imaging. Molecular subtypes were predicted by an overall accuracy of 91.2% using a classifier score. Our study indicates a first step into combining the metabolic and molecular traits of lesions for advancing the pre-operative diagnostic workup of brain tumors and improve personalized tumor treatment.
Keywords: 1H-MRS; MR spectroscopy; MRS; chemical shift imaging; glioma; magnetic resonance spectroscopy; neurooncology; neuroradiology; neurosurgery; radiomics.
Conflict of interest statement
No potential conflicts of interest were disclosed by the authors.
Figures
Similar articles
-
SPectroscOpic prediction of bRain Tumours (SPORT): study protocol of a prospective imaging trial.BMC Med Imaging. 2020 Nov 23;20(1):123. doi: 10.1186/s12880-020-00522-y. BMC Med Imaging. 2020. PMID: 33228567 Free PMC article.
-
Metabolic approach for tumor delineation in glioma surgery: 3D MR spectroscopy image-guided resection.J Neurosurg. 2016 Jun;124(6):1585-93. doi: 10.3171/2015.6.JNS142651. Epub 2015 Dec 4. J Neurosurg. 2016. PMID: 26636387
-
Preoperative magnetic resonance spectroscopy improves diagnostic accuracy in a series of neurosurgical dilemmas.Br J Neurosurg. 2013 Oct;27(5):646-53. doi: 10.3109/02688697.2013.771724. Epub 2013 Mar 5. Br J Neurosurg. 2013. PMID: 23461752
-
MR spectroscopy in pediatric neuroradiology.Transl Pediatr. 2021 Apr;10(4):1169-1200. doi: 10.21037/tp-20-445. Transl Pediatr. 2021. PMID: 34012861 Free PMC article. Review.
-
MR Molecular Imaging of Brain Cancer Metabolism Using Hyperpolarized 13C Magnetic Resonance Spectroscopy.Top Magn Reson Imaging. 2016 Oct;25(5):187-196. doi: 10.1097/RMR.0000000000000104. Top Magn Reson Imaging. 2016. PMID: 27748711 Free PMC article. Review.
Cited by
-
Establishing Imaging Biomarkers of Host Immune System Efficacy during Glioblastoma Therapy Response: Challenges, Obstacles and Future Perspectives.Metabolites. 2022 Mar 14;12(3):243. doi: 10.3390/metabo12030243. Metabolites. 2022. PMID: 35323686 Free PMC article.
-
Proton MR spectroscopy shows improved performance to segregate high-grade astrocytoma subgroups when defined with the new 2021 World Health Organization classification of central nervous system tumors.Eur Radiol. 2024 Apr;34(4):2174-2182. doi: 10.1007/s00330-023-10138-9. Epub 2023 Sep 23. Eur Radiol. 2024. PMID: 37740778
-
Diagnostic and Therapeutic Issues in Glioma Using Imaging Data: The Challenge of Numerical Twinning.J Clin Med. 2023 Dec 15;12(24):7706. doi: 10.3390/jcm12247706. J Clin Med. 2023. PMID: 38137775 Free PMC article. Review.
-
Radiomics in glioma: emerging trends and challenges.Ann Clin Transl Neurol. 2025 Mar;12(3):460-477. doi: 10.1002/acn3.52306. Epub 2025 Feb 3. Ann Clin Transl Neurol. 2025. PMID: 39901654 Free PMC article. Review.
References
-
- Louis D.N., Perry A., Reifenberger G., von Deimling A., Figarella-Branger D., Cavenee W.K., Ohgaki H., Wiestler O.D., Kleihues P., Ellison D.W. The 2016 World Health Organization Classification of Tumors of the Central Nervous System: A summary. Acta Neuropathol. 2016;131:803–820. doi: 10.1007/s00401-016-1545-1. - DOI - PubMed
-
- Choi C., Ganji S.K., DeBerardinis R.J., Hatanpaa K.J., Rakheja D., Kovacs Z., Yang X.-L., Mashimo T., Raisanen J.M., Marin-Valencia I., et al. 2-hydroxyglutarate detection by magnetic resonance spectroscopy in IDH-mutated patients with gliomas. Nat. Med. 2012;18:624–629. doi: 10.1038/nm.2682. - DOI - PMC - PubMed
-
- Diamandis E., Gabriel C.P.S., Würtemberger U., Guggenberger K., Urbach H., Staszewski O., Lassmann S., Schnell O., Grauvogel J., Mader I., et al. MR-spectroscopic imaging of glial tumors in the spotlight of the 2016 WHO classification. J. Neurooncol. 2018;139:431–440. doi: 10.1007/s11060-018-2881-x. - DOI - PubMed
-
- Di Ieva A., Magnussen J.S., McIntosh J., Mulcahy M.J., Pardey M., Choi C. Magnetic Resonance Spectroscopic Assessment of Isocitrate Dehydrogenase Status in Gliomas: The New Frontiers of Spectrobiopsy in Neurodiagnostics. World Neurosurg. 2020;133:e421–e427. doi: 10.1016/j.wneu.2019.09.040. - DOI - PubMed
-
- Heiland D.H., Mader I., Schlosser P., Pfeifer D., Carro M.S., Lange T., Schwarzwald R., Vasilikos I., Urbach H., Weyerbrock A. Integrative Network-based Analysis of Magnetic Resonance Spectroscopy and Genome Wide Expression in Glioblastoma multiforme. Sci. Rep. 2016;6:29052. doi: 10.1038/srep29052. - DOI - PMC - PubMed
Grants and funding
LinkOut - more resources
Full Text Sources
