Review
. 2021 May 17;22(10):5282.
doi: 10.3390/ijms22105282.

Understanding LAG-3 Signaling

Affiliations
Review

Understanding LAG-3 Signaling

Luisa Chocarro et al. Int J Mol Sci. .

Abstract

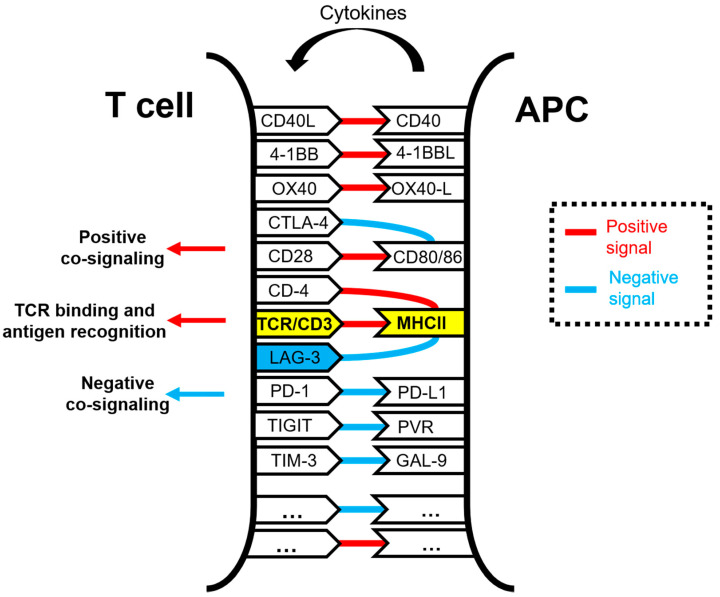
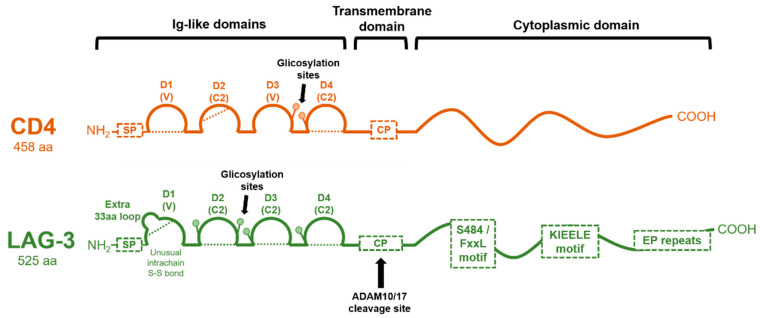
Lymphocyte activation gene 3 (LAG-3) is a cell surface inhibitory receptor with multiple biological activities over T cell activation and effector functions. LAG-3 plays a regulatory role in immunity and emerged some time ago as an inhibitory immune checkpoint molecule comparable to PD-1 and CTLA-4 and a potential target for enhancing anti-cancer immune responses. LAG-3 is the third inhibitory receptor to be exploited in human anti-cancer immunotherapies, and it is considered a potential next-generation cancer immunotherapy target in human therapy, right next to PD-1 and CTLA-4. Unlike PD-1 and CTLA-4, the exact mechanisms of action of LAG-3 and its relationship with other immune checkpoint molecules remain poorly understood. This is partly caused by the presence of non-conventional signaling motifs in its intracellular domain that are different from other conventional immunoregulatory signaling motifs but with similar inhibitory activities. Here we summarize the current understanding of LAG-3 signaling and its role in LAG-3 functions, from its mechanisms of action to clinical applications.

Keywords: LAG-3; cancer signaling; immune checkpoint; immunotherapy; targeted therapy.


Conflict of interest statement

The authors declare no conflict of interest.

Figures

Figure 1
Figure 1
Schematic representation of the molecular interactions occurring within the immunological synapse between a T cell and an antigen-presenting cell (APC) during antigen presentation and T cell activation. The TCR/CD3 and MHC complexes are highlighted in yellow. Some of the well-known co-stimulatory and co-inhibitory receptor–ligand interactions are shown in the figure, linked by red lines for activating interactions and with blue lines for inhibitory interactions. Antigenic peptides presented by APCs loaded in MHC molecules are specifically recognized by the TCR, while other interactions take place simultaneously to deliver co-stimulatory and co-inhibitory signals. These interactions are integrated within T cells. The LAG-3 molecule is highlighted in blue.
Figure 2
Figure 2
Molecular organization of CD4 and LAG-3 proteins. The domain organization of CD4 and LAG-3 is schematically shown in the figure, with each Ig-like domain indicated as arcs. Dotted lines represent disulfide bonds. The cleavage site for ADAM 10/17 in LAG-3 is shown, rendering a soluble version. CP: connecting peptide; SP: signal peptide.
Figure 3
Figure 3
LAG-3 protein and RNA expression profiles from Protein Atlas Analyses (http://www.proteinatlas.org; accessed on 2 May 2021). Images and data credit: Human Protein Atlas. Image and data available from: LAG3 protein expression profiles, The Human Protein Atlas. (A) LAG-3 consensus normalized expression (NX) levels for 55 tissue types and 6 blood cell types, created by combining the data from the three transcriptomics datasets (HPA, GTEx, and FANTOM5), using the internal normalization pipeline. Color coding is based on tissue groups by common functional features. RNA tissue specificity is enhanced in lymphoid and ovary tissues. (B) Summary of LAG-3 single-cell RNA (NX) from the indicated single cell types. Color coding is based on cell type groups, each consisting of cell types with functional features in common. (C) The bar graph represents quantification of RNA-seq data (pTPM) from blood cell types and total peripheral blood mononuclear cells (PBMC) that have been separated into subpopulations by flow sorting.
Figure 4
Figure 4
Genomic annotations of the Lag-3 gene locus. The Lag-3 locus is located at chromosome 12: 6,881,678-6,887,621 forward strand. The illustration shows the organization of the Lag-3 locus (http://grch37.ensembl.org/Homo_sapiens/Gene/Summary?db=core;g=ENSG00000089692;r=12:6881678-6887621, accessed on 2 May 2021) [62]. The black bar represents chromosome 12, with positions indicated on top. In green is the Lag-3 coding region. In blue is the transcript retaining one intron. In red is the canonical Lag-3 transcript. In red and blue is the alternatively-spliced Lag-3 transcript. The positions of single-nucleotide polymorphisms are shown below the canonical Lag-3 transcript. The promoter regions are also indicated in pink.

Similar articles

Cited by

References

    1. Huard B., Tournier M., Hercend T., Triebel F., Faure F. Lymphocyte-Activation Gene 3/Major Histocompatibility Complex Class II Interaction Modulates the Antigenic Response of CD4+ T Lymphocytes. Eur. J. Immunol. 1994;24:3216–3221. doi: 10.1002/eji.1830241246. - DOI - PubMed
    1. Huard B., Prigent P., Pagès F., Bruniquel D., Triebel F. T Cell Major Histocompatibility Complex Class II Molecules Down-Regulate CD4+ T Cell Clone Responses Following LAG-3 Binding. Eur. J. Immunol. 1996;26:1180–1186. doi: 10.1002/eji.1830260533. - DOI - PubMed
    1. Workman C.J., Dugger K.J., Vignali D.A.A. Cutting Edge: Molecular Analysis of the Negative Regulatory Function of Lymphocyte Activation Gene-3. J. Immunol. 2002;169:5392–5395. doi: 10.4049/jimmunol.169.10.5392. - DOI - PubMed
    1. Workman C.J., Rice D.S., Dugger K.J., Kurschner C., Vignali D.A.A. Phenotypic Analysis of the Murine CD4-Related Glycoprotein, CD223 (LAG-3) Eur. J. Immunol. 2002;32:2255–2263. doi: 10.1002/1521-4141(200208)32:8<2255::AID-IMMU2255>3.0.CO;2-A. - DOI - PubMed
    1. Workman C.J., Cauley L.S., Kim I.-J., Blackman M.A., Woodland D.L., Vignali D.A.A. Lymphocyte Activation Gene-3 (CD223) Regulates the Size of the Expanding T Cell Population Following Antigen Activation in vivo. J. Immunol. 2004;172:5450–5455. doi: 10.4049/jimmunol.172.9.5450. - DOI - PubMed

LinkOut - more resources