

Rapid Assessment of Non-Verbal Auditory Perception in Normal-Hearing Participants and Cochlear Implant Users
- PMID: 34068067
- PMCID: PMC8152499
- DOI: 10.3390/jcm10102093
Rapid Assessment of Non-Verbal Auditory Perception in Normal-Hearing Participants and Cochlear Implant Users
Abstract
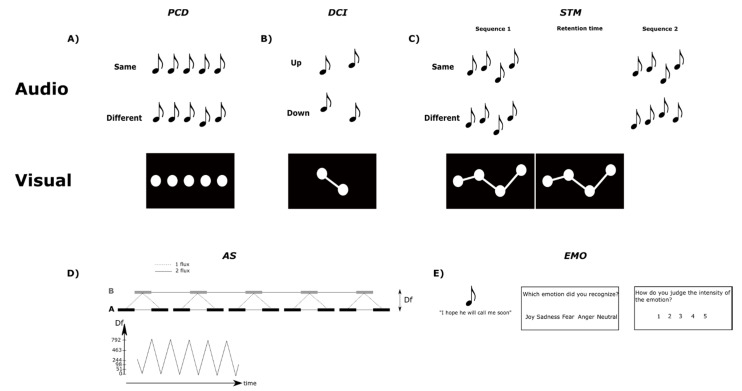
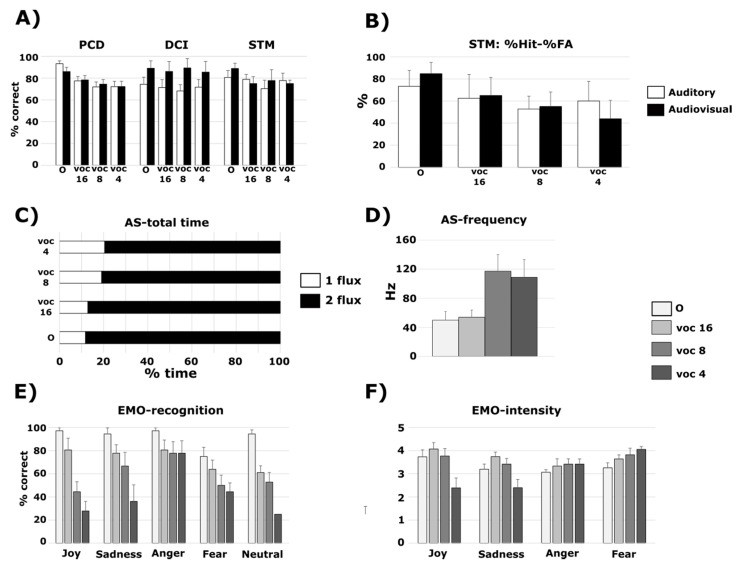
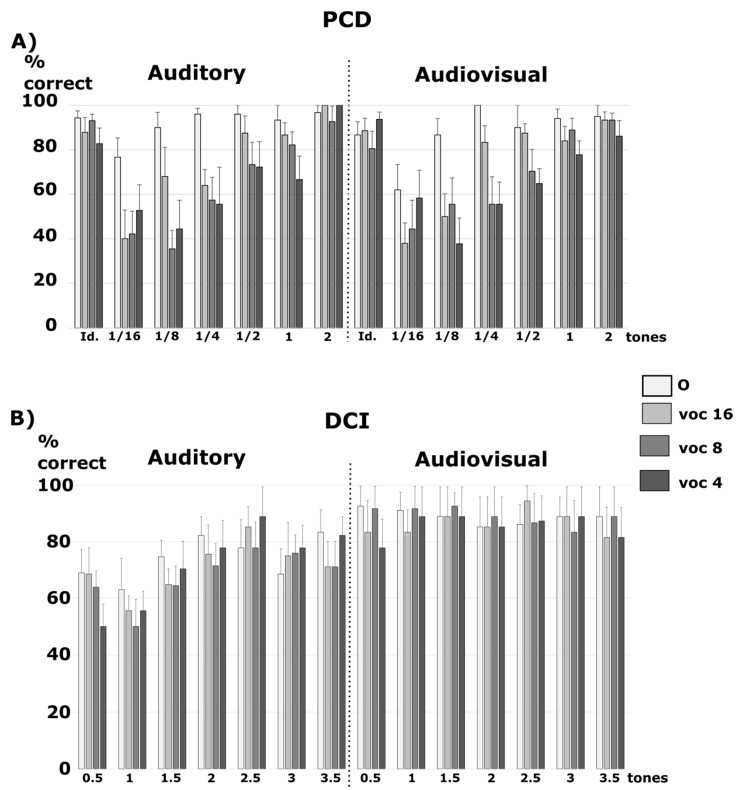
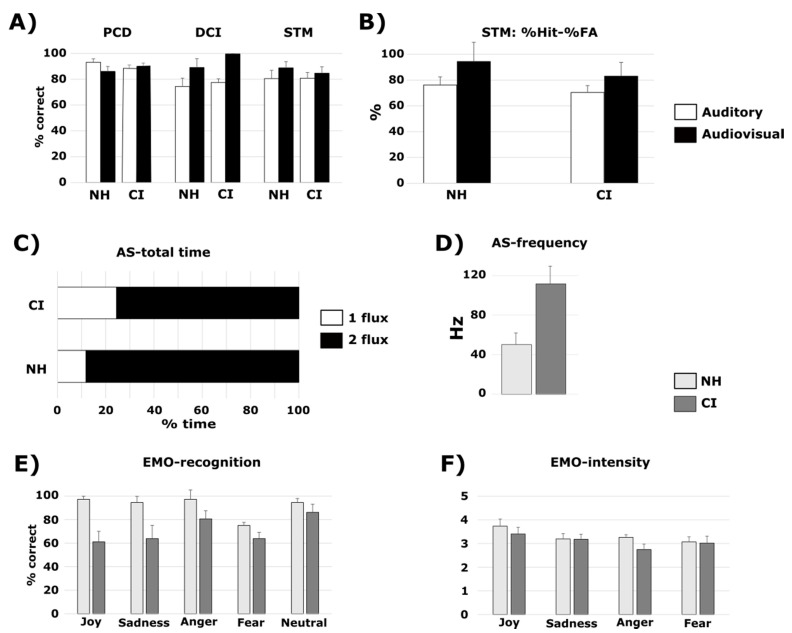
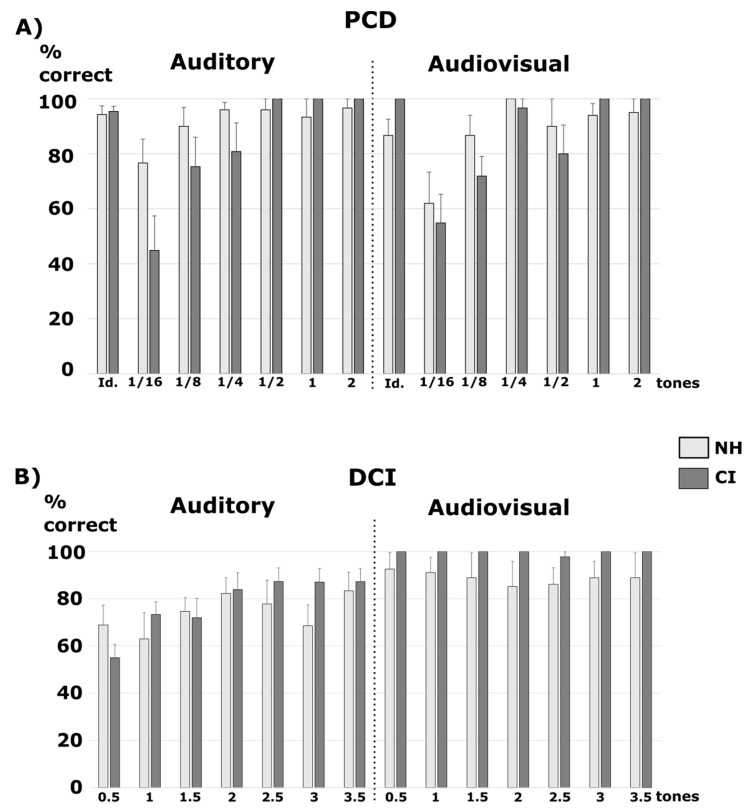
In the case of hearing loss, cochlear implants (CI) allow for the restoration of hearing. Despite the advantages of CIs for speech perception, CI users still complain about their poor perception of their auditory environment. Aiming to assess non-verbal auditory perception in CI users, we developed five listening tests. These tests measure pitch change detection, pitch direction identification, pitch short-term memory, auditory stream segregation, and emotional prosody recognition, along with perceived intensity ratings. In order to test the potential benefit of visual cues for pitch processing, the three pitch tests included half of the trials with visual indications to perform the task. We tested 10 normal-hearing (NH) participants with material being presented as original and vocoded sounds, and 10 post-lingually deaf CI users. With the vocoded sounds, the NH participants had reduced scores for the detection of small pitch differences, and reduced emotion recognition and streaming abilities compared to the original sounds. Similarly, the CI users had deficits for small differences in the pitch change detection task and emotion recognition, as well as a decreased streaming capacity. Overall, this assessment allows for the rapid detection of specific patterns of non-verbal auditory perception deficits. The current findings also open new perspectives about how to enhance pitch perception capacities using visual cues.
Keywords: audiovisual integration; auditory scene analysis; hearing loss; pitch perception; prosody.
Conflict of interest statement
The authors declare no conflict of interest.
Figures
Similar articles
-
Visual Temporal Acuity Is Related to Auditory Speech Perception Abilities in Cochlear Implant Users.Ear Hear. 2017 Mar/Apr;38(2):236-243. doi: 10.1097/AUD.0000000000000379. Ear Hear. 2017. PMID: 27764001 Free PMC article.
-
The musician effect: does it persist under degraded pitch conditions of cochlear implant simulations?Front Neurosci. 2014 Jun 30;8:179. doi: 10.3389/fnins.2014.00179. eCollection 2014. Front Neurosci. 2014. PMID: 25071428 Free PMC article.
-
What breaks a melody: perceiving F0 and intensity sequences with a cochlear implant.Hear Res. 2010 Oct 1;269(1-2):34-41. doi: 10.1016/j.heares.2010.07.007. Epub 2010 Jul 30. Hear Res. 2010. PMID: 20674733
-
Music perception with cochlear implants: a review.Trends Amplif. 2004;8(2):49-82. doi: 10.1177/108471380400800203. Trends Amplif. 2004. PMID: 15497033 Free PMC article. Review.
-
Multisensory Integration in Cochlear Implant Recipients.Ear Hear. 2017 Sep/Oct;38(5):521-538. doi: 10.1097/AUD.0000000000000435. Ear Hear. 2017. PMID: 28399064 Free PMC article. Review.
Cited by
-
Effects of mild-to-moderate sensorineural hearing loss and signal amplification on vocal emotion recognition in middle-aged-older individuals.PLoS One. 2022 Jan 7;17(1):e0261354. doi: 10.1371/journal.pone.0261354. eCollection 2022. PLoS One. 2022. Update in: PLoS One. 2025 Jul 16;20(7):e0322867. doi: 10.1371/journal.pone.0322867. PMID: 34995305 Free PMC article. Updated.
-
Continuous monitoring of temporal skills during long-term in-home training by cochlear implant users.Heliyon. 2025 Jan 9;11(3):e41817. doi: 10.1016/j.heliyon.2025.e41817. eCollection 2025 Feb 15. Heliyon. 2025. PMID: 39975818 Free PMC article.
-
The impact of visual information in speech perception for individuals with hearing loss: a mini review.Front Psychol. 2024 Sep 24;15:1399084. doi: 10.3389/fpsyg.2024.1399084. eCollection 2024. Front Psychol. 2024. PMID: 39380752 Free PMC article. Review.
References
-
- Bregman A.S., McAdams S. Auditory Scene Analysis: The Perceptual Organization of Sound. J. Acoust. Soc. Am. 1994;95:1177–1178. doi: 10.1121/1.408434. - DOI
Grants and funding
LinkOut - more resources
Full Text Sources
