

Dysregulation of Glycerophosphocholines in the Cutaneous Lesion Caused by Leishmania major in Experimental Murine Models
- PMID: 34068119
- PMCID: PMC8152770
- DOI: 10.3390/pathogens10050593
Dysregulation of Glycerophosphocholines in the Cutaneous Lesion Caused by Leishmania major in Experimental Murine Models
Abstract
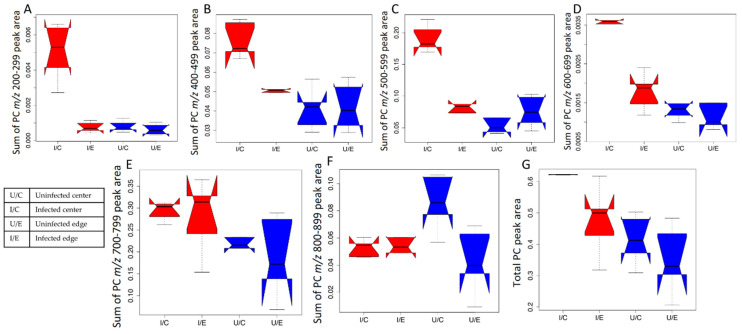
Cutaneous leishmaniasis (CL) is the most common disease form caused by a Leishmania parasite infection and considered a neglected tropical disease (NTD), affecting 700,000 to 1.2 million new cases per year in the world. Leishmania major is one of several different species of the Leishmania genus that can cause CL. Current CL treatments are limited by adverse effects and rising resistance. Studying disease metabolism at the site of infection can provide knowledge of new targets for host-targeted drug development. In this study, tissue samples were collected from mice infected in the ear or footpad with L. major and analyzed by untargeted liquid chromatography-tandem mass spectrometry (LC-MS/MS). Significant differences in overall metabolite profiles were noted in the ear at the site of the lesion. Interestingly, lesion-adjacent, macroscopically healthy sites also showed alterations in specific metabolites, including selected glycerophosphocholines (PCs). Host-derived PCs in the lower m/z range (m/z 200-799) showed an increase with infection in the ear at the lesion site, while those in the higher m/z range (m/z 800-899) were decreased with infection at the lesion site. Overall, our results expanded our understanding of the mechanisms of CL pathogenesis through host metabolism and may lead to new curative measures against infection with Leishmania.
Keywords: Leishmania major; cutaneous leishmaniasis; glycerophosphocholines; host metabolism; neglected tropical diseases; untargeted metabolomics.
Conflict of interest statement
The authors declare no conflict of interest. The funders had no role in the design of the study; in the collection, analyses or interpretation of data; in the writing of the manuscript or in the decision to publish the results.
Figures


Similar articles
-
Identification of Immunodominant Antigens From a First-Generation Vaccine Against Cutaneous Leishmaniasis.Front Immunol. 2022 May 12;13:825007. doi: 10.3389/fimmu.2022.825007. eCollection 2022. Front Immunol. 2022. PMID: 35634280 Free PMC article.
-
Effects of negative air ions (NAIs) on Leishmania major: A novel tool for treatment of zoonotic cutaneous leishmaniasis (ZCL).PLoS One. 2022 Sep 8;17(9):e0274124. doi: 10.1371/journal.pone.0274124. eCollection 2022. PLoS One. 2022. PMID: 36074764 Free PMC article.
-
Tandem Mass Tag Proteomic Analysis of in Vitro and in Vivo Models of Cutaneous Leishmaniasis Reveals Parasite-Specific and Nonspecific Modulation of Proteins in the Host.ACS Infect Dis. 2019 Dec 13;5(12):2136-2147. doi: 10.1021/acsinfecdis.9b00275. Epub 2019 Oct 24. ACS Infect Dis. 2019. PMID: 31600437
-
Cutaneous Leishmaniasis: The Complexity of Host's Effective Immune Response against a Polymorphic Parasitic Disease.J Immunol Res. 2019 Dec 1;2019:2603730. doi: 10.1155/2019/2603730. eCollection 2019. J Immunol Res. 2019. PMID: 31871953 Free PMC article. Review.
-
Understanding the immune responses involved in mediating protection or immunopathology during leishmaniasis.Biochem Soc Trans. 2021 Feb 26;49(1):297-311. doi: 10.1042/BST20200606. Biochem Soc Trans. 2021. PMID: 33449103 Review.
Cited by
-
The intersection of host in vivo metabolism and immune responses to infection with kinetoplastid and apicomplexan parasites.Microbiol Mol Biol Rev. 2024 Mar 27;88(1):e0016422. doi: 10.1128/mmbr.00164-22. Epub 2024 Feb 1. Microbiol Mol Biol Rev. 2024. PMID: 38299836 Free PMC article. Review.
-
Chemical Cartography Approaches to Study Trypanosomatid Infection.J Vis Exp. 2022 Jan 21;(179):10.3791/63255. doi: 10.3791/63255. J Vis Exp. 2022. PMID: 35129167 Free PMC article.
-
Localized cardiac small molecule trajectories and persistent chemical sequelae in experimental Chagas disease.Nat Commun. 2023 Oct 25;14(1):6769. doi: 10.1038/s41467-023-42247-w. Nat Commun. 2023. PMID: 37880260 Free PMC article.
-
Molecular networking in infectious disease models.Methods Enzymol. 2022;663:341-375. doi: 10.1016/bs.mie.2021.09.018. Epub 2021 Oct 26. Methods Enzymol. 2022. PMID: 35168796 Free PMC article.
-
Leishmania mexicana promotes pain-reducing metabolomic reprogramming in cutaneous lesions.iScience. 2023 Nov 22;26(12):108502. doi: 10.1016/j.isci.2023.108502. eCollection 2023 Dec 15. iScience. 2023. PMID: 38125023 Free PMC article.
References
Grants and funding
LinkOut - more resources
Full Text Sources
