. 2021 May 13;26(10):2898.
doi: 10.3390/molecules26102898.

Biocompatible Ir(III) Complexes as Oxygen Sensors for Phosphorescence Lifetime Imaging

Affiliations

Biocompatible Ir(III) Complexes as Oxygen Sensors for Phosphorescence Lifetime Imaging

Ilya S Kritchenkov et al. Molecules. .

Abstract

Synthesis of biocompatible near infrared phosphorescent complexes and their application in bioimaging as triplet oxygen sensors in live systems are still challenging areas of organometallic chemistry. We have designed and synthetized four novel iridium [Ir(N^C)2(N^N)]+ complexes (N^C-benzothienyl-phenanthridine based cyclometalated ligand; N^N-pyridin-phenanthroimidazol diimine chelate), decorated with oligo(ethylene glycol) groups to impart these emitters' solubility in aqueous media, biocompatibility, and to shield them from interaction with bio-environment. These substances were fully characterized using NMR spectroscopy and ESI mass-spectrometry. The complexes exhibited excitation close to the biological "window of transparency", NIR emission at 730 nm, and quantum yields up to 12% in water. The compounds with higher degree of the chromophore shielding possess low toxicity, bleaching stability, absence of sensitivity to variations of pH, serum, and complex concentrations. The properties of these probes as oxygen sensors for biological systems have been studied by using phosphorescence lifetime imaging experiments in different cell cultures. The results showed essential lifetime response onto variations in oxygen concentration (2.0-2.3 μs under normoxia and 2.8-3.0 μs under hypoxia conditions) in complete agreement with the calibration curves obtained "in cuvette". The data obtained indicate that these emitters can be used as semi-quantitative oxygen sensors in biological systems.

Keywords: Ir(III) complexes; NIR emitters; oxygen sensing; phosphorescence lifetime imaging.


Conflict of interest statement

Author Vladislav Shcheslavskiy is employed by the company Becker&Hickl GmbH. The remaining authors declare that the research was conducted in the absence of any commercial or financial relationships that could be construed as a potential conflict of interest.

Figures

Figure 5
Figure 5
MTT assay of CT26 (A), HeLa (B), and CHO-K1 (C) cells after incubation with Ir1, Ir2, Ir2a for 24 h at different concentrations. Cell viability of control cells (without probe) was taken for 1. Mean ± standard deviation. N = 30 repetitions for CT26, 15 repetitions for HeLa, and 5 repetitions for CHO-K1 cells.
Scheme 1
Scheme 1
Synthesis of cyclometallating and diimine ligands N^C1, N^C2, N^N1 and N^N2.
Scheme 2
Scheme 2
Synthesis of iridium complexes Ir1, Ir1a, Ir2, and Ir2a.
Figure 1
Figure 1
1H-1H COSY and NOESY NMR spectra of Ir1, CD3OD, 323 K. Red diagonal and cross-peaks are related to the COSY spectrum, green diagonal and cross-peaks are from the NOESY spectrum. Pairs of protons generating NOESY cross-peaks, which do not coincide with the COSY signals, are circled with colored dashed lines both in the spectrum and in the structural pattern.
Figure 2
Figure 2
Optimized structure of the model Ir0 complex (hydrogen atoms are omitted for clarity). The calculations have been slightly simplified by substitution of OEG pendants with methyl groups. Atom colors: Ir–blue; N–red; S–yellow; O–green; C–gray.
Figure 3
Figure 3
Normalized excitation (dashed lines) and emission (solid lines) spectra of Ir1, Ir2, and Ir2a in aqueous solution at 298 K.
Figure 4
Figure 4
Stern–Volmer oxygen quenching plots for Ir2 (A) and Ir2a (B) in aqueous solution, 0.01 M phosphate buffered saline (pH 7.4) and in fetal bovine serum (T = 37 °C). (Ksv-Stern–Volmer constant).
Figure 6
Figure 6
Dynamics of Ir2 and Ir2a (75 µM) accumulation by HeLa cells during long-term incubation carried out in DMEM supplemented with 10% FBS. Scale bar 20 µm. (A,B) Representative microscopy images of cells in luminescence channel (upper row, excitation 405 nm, recording 690–790 nm, red color) and in transmission channel (bottom row). (C,D) Quantification of the experimental data shown in A and B, correspondingly. Integral luminescence intensity per cell is presented. 50 cells were processed for each time point. The results are given as the mean ± standard deviation. Scale bar 20 µm.
Figure 7
Figure 7
Subcellular distribution of complexes Ir2 and Ir2a (75 µM) in HeLa cells (red color of luminescence). Cells were co-stained with complexes and organelle-specific probes for nuclei-Hoechst 33342 (blue color of luminescence), mitochondria-MitoTracker Green (green color of luminescence), and lysosomes-LysoTracker Green (green color of luminescence). Scale bar 20 µm. Manders’ overlap coefficients (M1) shown in the pictures are presented as mean + standard deviation, calculated for 50 cells for every variant.
Figure 8
Figure 8
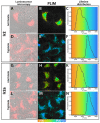
Phosphorescence lifetime distribution in HeLa cells incubated with 75 µM of Ir2 (AF) and Ir2a (GN) for 24 h under normoxia (A–C, G–K) and hypoxia conditions (D–F, L–N). A, D, G, L—luminescent microscopy (excitation 405 nm, detection 663–738 nm) stacked with DIC (differential interference contrast) image. B, E, H, M—PLIM images (excitation 405 nm, detection 690–750 nm), colors corresponds to the lifetime in the range 1700–3600 ns. C, F, K, N—lifetime distribution for whole PLIM image.

References

    1. Tsai A.G., Johnson P.C., Intaglietta M. Oxygen gradients in the microcirculation. Physiol. Rev. 2003;83:933–963. doi: 10.1152/physrev.00034.2002. - DOI - PubMed
    1. Masson N., Ratcliffe P.J. Hypoxia signaling pathways in cancer metabolism: The importance of co-selecting interconnected physiological pathways. Cancer Metab. 2014;2:3. doi: 10.1186/2049-3002-2-3. - DOI - PMC - PubMed
    1. Al Tameemi W., Dale T.P., Al-Jumaily R.M.K., Forsyth N.R. Hypoxia-modified cancer cell metabolism. Front. Cell Dev. Biol. 2019;7:4. doi: 10.3389/fcell.2019.00004. - DOI - PMC - PubMed
    1. Semenza G.L. Regulation of oxygen homeostasis by hypoxia-inducible factor 1. Physiology. 2009;24:97–106. doi: 10.1152/physiol.00045.2008. - DOI - PubMed
    1. Sanderson T.H., Reynolds C.A., Kumar R., Przyklenk K., Hüttemann M. Molecular mechanisms of ischemia–reperfusion injury in brain: Pivotal role of the mitochondrial membrane potential in reactive oxygen species generation. Mol. Neurobiol. 2013;47:9–23. doi: 10.1007/s12035-012-8344-z. - DOI - PMC - PubMed

LinkOut - more resources