

TRPV1 Responses in the Cerebellum Lobules VI, VII, VIII Using Electroacupuncture Treatment for Chronic Pain and Depression Comorbidity in a Murine Model
- PMID: 34068557
- PMCID: PMC8126051
- DOI: 10.3390/ijms22095028
TRPV1 Responses in the Cerebellum Lobules VI, VII, VIII Using Electroacupuncture Treatment for Chronic Pain and Depression Comorbidity in a Murine Model
Abstract
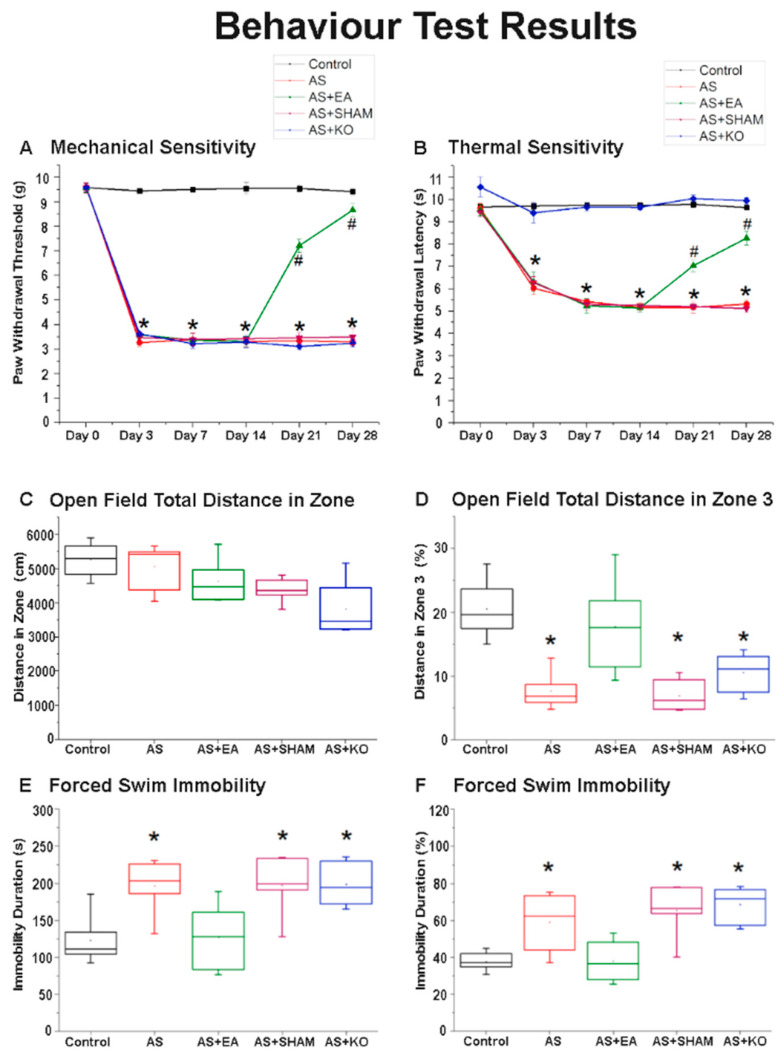
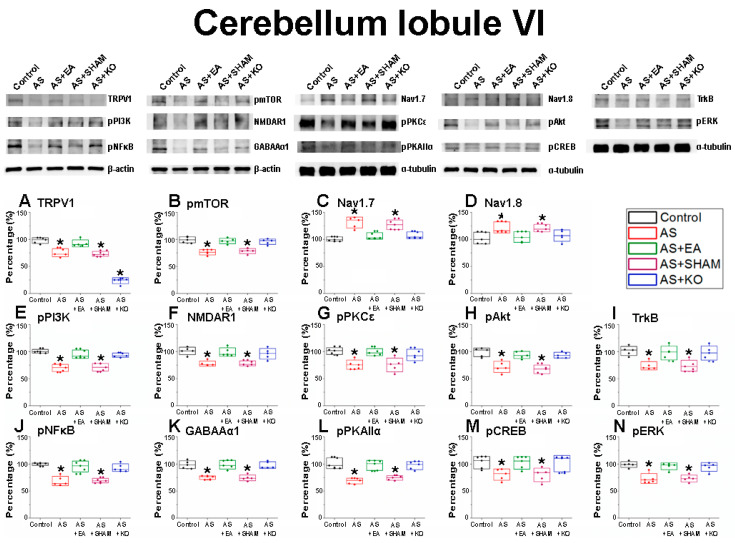
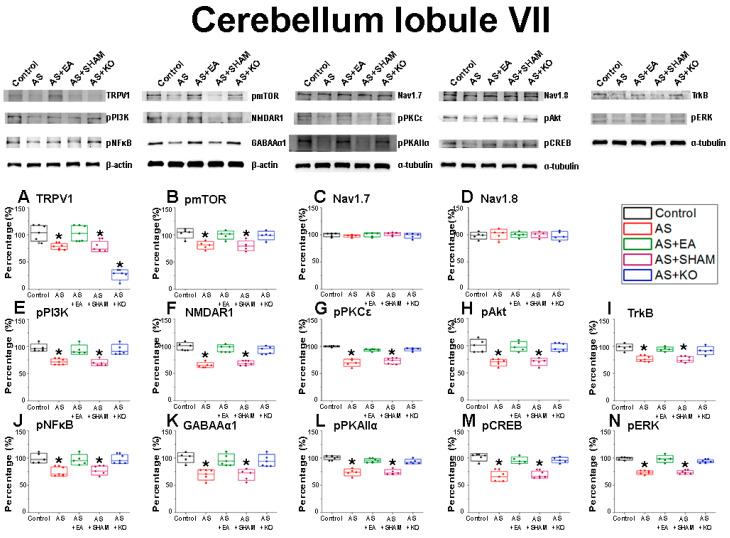
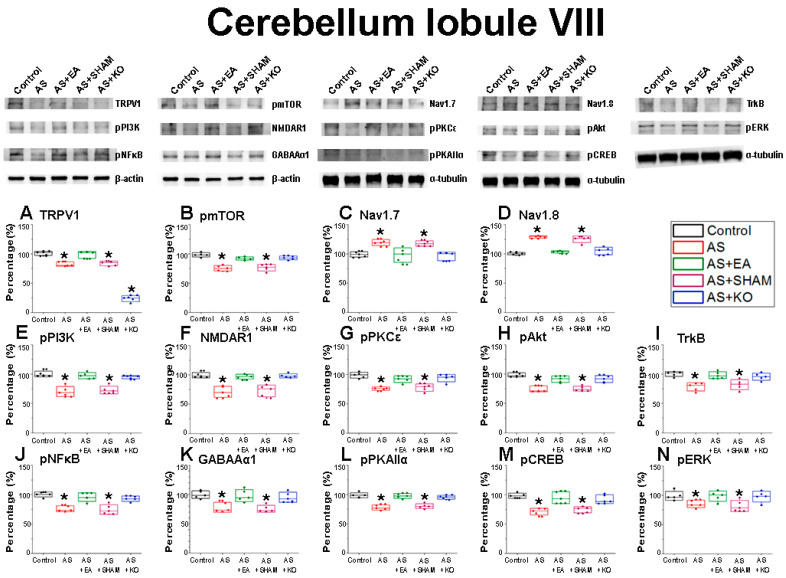
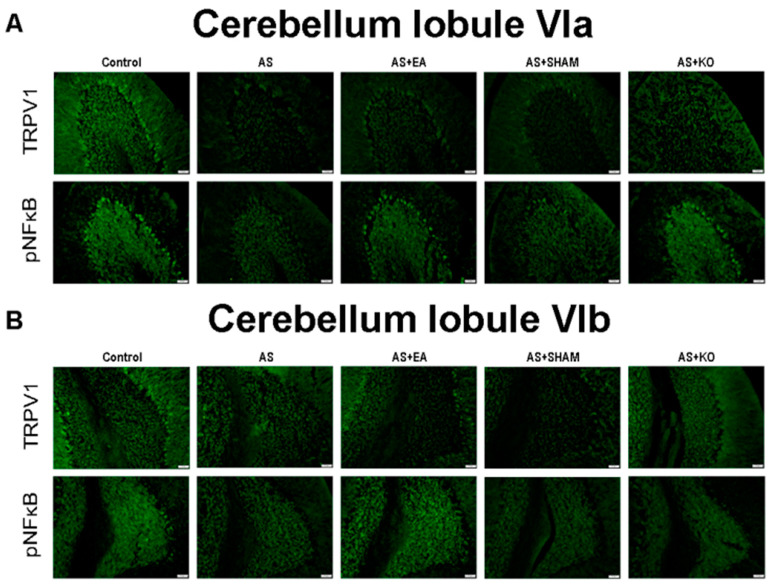
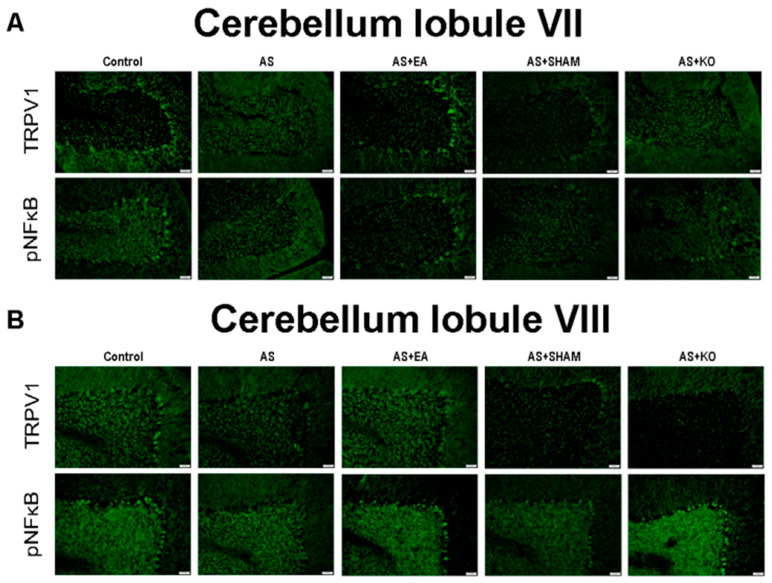
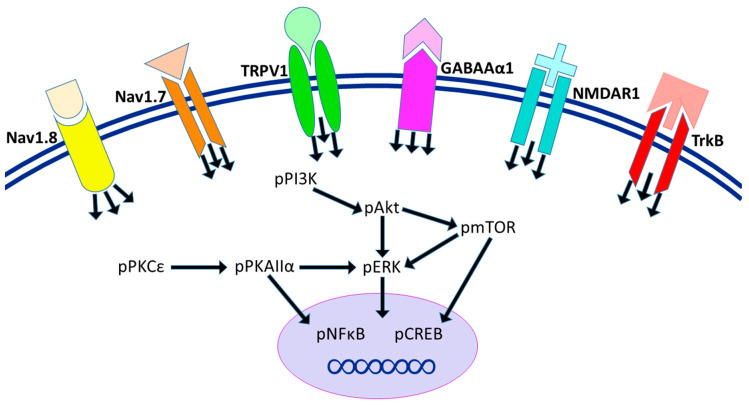
Depression is a prominent complex psychiatric disorder, usually complicated through expression of comorbid conditions, with chronic pain being among the most prevalent. This comorbidity is consistently associated with a poor prognosis and has been shown to negatively impact patient outcomes. With a global rise in this condition presenting itself, the importance of discovering long-term, effective, and affordable treatments is crucial. Electroacupuncture has demonstrated renowned success in its use for the treatment of pain and is a widely recognized therapy in clinical practice for the treatment of various psychosomatic disorders, most notably depression. Our study aimed to investigate the effects and mechanisms of Acid-Saline (AS) inducing states of chronic pain and depression comorbidity in the cerebellum, using the ST36 acupoint as the therapeutic intervention. Furthermore, the role of TRPV1 was relatedly explored through the use of TRPV1-/- mice (KO). The results indicated significant differences in the four behavioral tests used to characterize pain and depression states in mice. The AS and AS + SHAM group showed significant differences when compared to the Control and AS + EA groups in the von Frey and Hargreaves's tests, as well as the Open-Field and Forced Swimming tests. This evidence was further substantiated in the protein levels observed in immunoblotting, with significant differences between the AS and AS + SHAM groups when compared to the AS + EA and AS + KO groups being identified. In addition, immunofluorescence visibly served to corroborate the quantitative outcomes. Conclusively these findings suggest that AS-induced chronic pain and depression comorbidity elicits changes in the cerebellum lobules VI, VII, VIII, which are ameliorated through the use of EA at ST36 via its action on TRPV1 and related molecular pathways. The action of TRPV1 is not singular in CPDC, which would suggest other potential targets such as acid-sensing ion channel subtype 3 (ASIC3) or voltage-gated sodium channels (Navs) that could be explored in future studies.
Keywords: ST36; TRPV1; cerebellum; chronic pain; depression; electroacupuncture.
Conflict of interest statement
The authors declare no conflict of interest.
Figures
Similar articles
-
TRPV1 Responses in the Cerebellum Lobules V, VIa and VII Using Electroacupuncture Treatment for Inflammatory Hyperalgesia in Murine Model.Int J Mol Sci. 2020 May 7;21(9):3312. doi: 10.3390/ijms21093312. Int J Mol Sci. 2020. PMID: 32392831 Free PMC article.
-
Distinct roles of ASIC3 and TRPV1 receptors in electroacupuncture-induced segmental and systemic analgesia.Front Med. 2016 Dec;10(4):465-472. doi: 10.1007/s11684-016-0482-7. Epub 2016 Dec 23. Front Med. 2016. PMID: 27896621
-
Electroacupuncture Attenuates Chronic Inflammatory Pain and Depression Comorbidity through Transient Receptor Potential V1 in the Brain.Am J Chin Med. 2021;49(6):1417-1435. doi: 10.1142/S0192415X2150066X. Epub 2021 Jul 3. Am J Chin Med. 2021. PMID: 34224338
-
Supraspinal Transient Receptor Potential Subfamily V Member 1 (TRPV1) in Pain and Psychiatric Disorders.Mod Trends Pharmacopsychiatry. 2015;30:80-93. doi: 10.1159/000435934. Epub 2015 Sep 18. Mod Trends Pharmacopsychiatry. 2015. PMID: 26436415 Review.
-
Role of GABAergic system in the comorbidity of pain and depression.Brain Res Bull. 2023 Aug;200:110691. doi: 10.1016/j.brainresbull.2023.110691. Epub 2023 Jun 17. Brain Res Bull. 2023. PMID: 37331640 Review.
Cited by
-
Gender Differences in Amplitude of Low-Frequency Fluctuation Alterations in Healthy Volunteers by Acupuncture on Left "LI 15": A Resting-State fMRI Study.Behav Neurol. 2024 Oct 28;2024:3986094. doi: 10.1155/2024/3986094. eCollection 2024. Behav Neurol. 2024. PMID: 39502831 Free PMC article.
-
Efficacy and safety of electroacupuncture in patients with postpartum depression: a meta-analysis.Front Psychiatry. 2024 Jul 11;15:1393531. doi: 10.3389/fpsyt.2024.1393531. eCollection 2024. Front Psychiatry. 2024. PMID: 39056020 Free PMC article.
-
Relationship between acupuncture and transient receptor potential vanilloid: Current and future directions.Front Mol Neurosci. 2022 Nov 3;15:817738. doi: 10.3389/fnmol.2022.817738. eCollection 2022. Front Mol Neurosci. 2022. PMID: 36407763 Free PMC article. Review.
-
Pregabalin and hyperbaric oxygen therapy on pain thresholds and anxio-depressive behaviors in a preclinical fibromyalgia pain model.Front Pain Res (Lausanne). 2023 Mar 1;4:1097457. doi: 10.3389/fpain.2023.1097457. eCollection 2023. Front Pain Res (Lausanne). 2023. PMID: 36937563 Free PMC article.
-
Electroacupuncture Attenuates Fibromyalgia Pain via Toll-like Receptor 4 in the Mouse Brain.Life (Basel). 2023 May 11;13(5):1160. doi: 10.3390/life13051160. Life (Basel). 2023. PMID: 37240805 Free PMC article.
References
-
- GBD 2016 Disease and Injury Incidence and Prevalence Collaborators Global, regional, and national incidence, prevalence, and years lived with disability for 328 diseases and inju-ries for 195 countries, 1990–2016: A systematic analysis for the Global Burden of Disease Study 2016. Lancet. 2017;390:1211–1259. doi: 10.1016/S0140-6736(17)32154-2. - DOI - PMC - PubMed
MeSH terms
Substances
Grants and funding
LinkOut - more resources
Full Text Sources
Medical
Molecular Biology Databases
Research Materials
