Review
. 2021 May 10;11(5):1249.
doi: 10.3390/nano11051249.

Hot Electrons in TiO2-Noble Metal Nano-Heterojunctions: Fundamental Science and Applications in Photocatalysis

Affiliations
Review

Hot Electrons in TiO2-Noble Metal Nano-Heterojunctions: Fundamental Science and Applications in Photocatalysis

Ajay P Manuel et al. Nanomaterials (Basel). .

Abstract

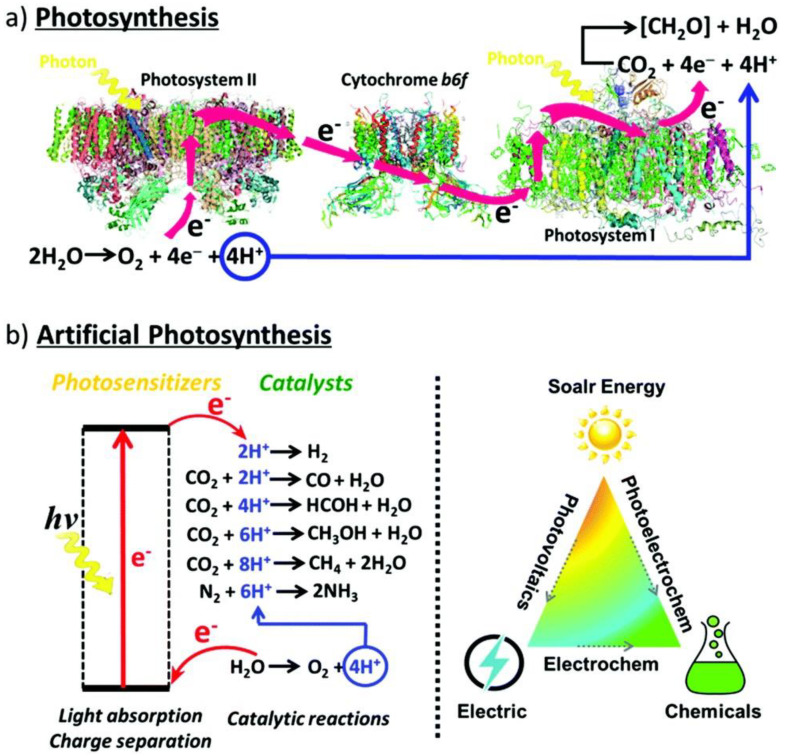
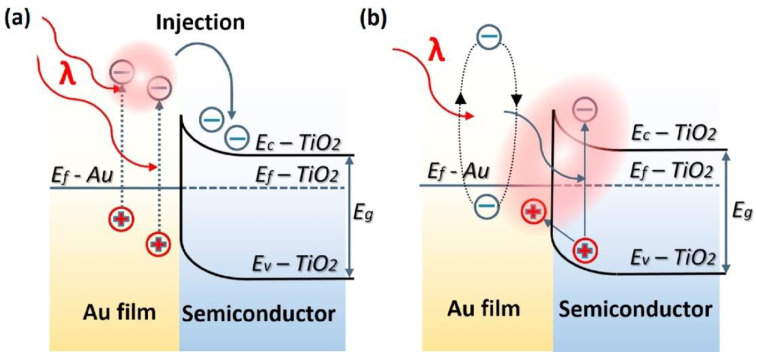
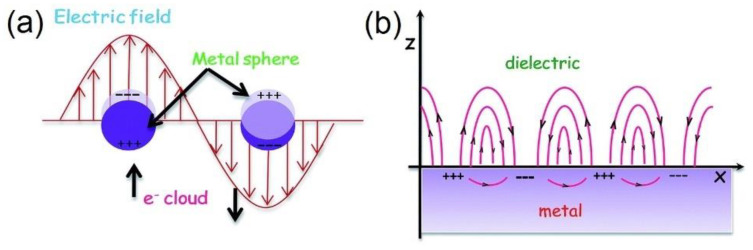
Plasmonic photocatalysis enables innovation by harnessing photonic energy across a broad swathe of the solar spectrum to drive chemical reactions. This review provides a comprehensive summary of the latest developments and issues for advanced research in plasmonic hot electron driven photocatalytic technologies focusing on TiO2-noble metal nanoparticle heterojunctions. In-depth discussions on fundamental hot electron phenomena in plasmonic photocatalysis is the focal point of this review. We summarize hot electron dynamics, elaborate on techniques to probe and measure said phenomena, and provide perspective on potential applications-photocatalytic degradation of organic pollutants, CO2 photoreduction, and photoelectrochemical water splitting-that benefit from this technology. A contentious and hitherto unexplained phenomenon is the wavelength dependence of plasmonic photocatalysis. Many published reports on noble metal-metal oxide nanostructures show action spectra where quantum yields closely follow the absorption corresponding to higher energy interband transitions, while an equal number also show quantum efficiencies that follow the optical response corresponding to the localized surface plasmon resonance (LSPR). We have provided a working hypothesis for the first time to reconcile these contradictory results and explain why photocatalytic action in certain plasmonic systems is mediated by interband transitions and in others by hot electrons produced by the decay of particle plasmons.

Keywords: Schottky barrier; TiO2; charge transfer; hot electron; nanoparticles; optical resonances; oxide interfaces; photoreduction; plasmon; solar energy conversion.


Conflict of interest statement

There are no conflict of interest to declare.

Figures

Figure 1
Figure 1
(a) Photosynthesis is enabled through the collaborative efforts of two photosynthetic complexes, PSI and PSII, where PSI serves as the reaction center and light harvesting complex and PSII is the site of water oxidation. Thus, H2O is oxidized in PSII into O2 releasing four protons and electrons, respectively, that are transferred via cytochrome b6f, an enzyme in plant chloroplasts, to PSI where they are consumed by CO2 reduction to produce carbohydrates. (b) Artificial photosynthetic systems for photocatalysis are being developed to mimic and provide for the very same conversion of solar energy through alternative energetic pathways and selectivity for fundamental and desirable chemical reactions, including water splitting, CO2 photoreduction, and the degradation of harmful organic pollutants. Reprinted with permission from Ref [10] with attribution and adherence to Creative Commons Attribution-NonCommercial 3.0 Unported Licence. Copyright Royal Society of Chemistry (2019).
Figure 2
Figure 2
Energy band-diagram of Au and n-type TiO2 heterojunction showing LSPR-driven hot electron injection from Au into TiO2 by (a) over barrier thermionic emission and (b) tunneling mechanism. Note the bending of the conduction and valence bands of TiO2 at the contact interface of the two materials due to the equilibration of Fermi levels upon contact forming a Schottky barrier. EF, EVB, ECB, ϕB, and L are the Fermi level, valence band level, conduction band level, Schottky barrier height, and the width of depletion layer, respectively. Reprinted with permission from Ref [70] Copyright Elsevier (2017).
Figure 3
Figure 3
Various nanoscale architectures that can be used in photocatalytic applications from (a) 0D nanocrystals, (b) 1D nanostructures, (c) 2D nanosheets and films, and (d) 0D-1D-2D integrated 3D nanostructures. The figure also illustrates the light scattering, light trapping, and charge transport processes in the corresponding nanostructures. Reprinted with permission from Ref [9] Copyright 2015 Royal Society of Chemistry. Figure 3d originally adapted by Ref [9] from Ref [86] with permission from John Wiley, and reprinted here with permission from John Wiley. Copyright John Wiley and Sons (2013).
Figure 4
Figure 4
Schematic illustrations of (a) Localized Surface Plasmon Resonances and (b) Surface Plasmon Polaritons. Note the differences in morphologies of the structures involved. LSPRs are excited on metal nanostructures smaller than the electron mean free path within the material as well as smaller than the wavelength of incident light, such as the nanospheres in (a) where free electrons are displaced from the positive ions, driven by the propagating electric field component of the incident light, and oscillate collectively in resonance. In (b) the metal surface’s characteristic dimension is larger than the wavelength of incident light resulting in the excitation of a propagating surface plasmon polariton that travels along the surface with evanescent waves that diminish perpendicular to the surface. Reprinted with permission from Ref [120] Copyright Royal Society of Chemistry (2016).
Figure 5
Figure 5
Modes of charge transfer and relaxation mechanisms in metal nanostructures. Ref [117] In the conventional charge transfer mechanism (a), resonant photon absorption creates hot electron-hole pairs within the metal nanostructure. What begins as an equilibrium thermal distribution of charge carriers in the metal nanostructure rapidly changes (i) to a nonequilibrium athermal hot electron distribution (~1 fs) (that cannot be described by Fermi–Dirac statistics) (ii) Hot electrons are now continuously transferred to the conduction band of the semiconductor from the tail portion of the electron distribution of the noble metal (iii) This athermal distribution rapidly dephases or cools through electron–electron collisions taking place on the order of ~100 fs. (iv) Further cooling through electron phonon collisions occurs on the order of ~1 ps resulting in the thermalization of the initial athermal distribution and a subsequent relaxation towards equilibrium. Alternatively, in (b) there is the Dissociation Induced Electron Transfer (DIET) mechanism, where electrons generated under excitation are directly injected into the conduction band of the semiconductor without and before any further interactions with other electrons. (ii) It is a direct, resonant transfer of charge carriers that circumvents the thermalization and relaxation mechanisms of hot electrons depicted in the sequential mechanism in (a). Reprinted with permission from Ref [117] Copyright American Chemical Society (2016).
Figure 6
Figure 6
A perspective on the various charge-separation pathways in noble metal–semiconductor systems. (a) The conventional plasmonic hot electron transfer (PHET) mechanism where a plasmon (blue ellipsoidal cloud) in the noble metal dephases into a hot electron-hole pair via Landau damping, following which, the hot electron is injected into the conduction band (CB) of the semiconductor. The electron-hole pairs generated in such a manner display a broad distribution of energies. (b) The IFCT mechanism where an electron in the noble metal is directly excited into the CB of the semiconductor, and its plasmonic counterpart in (c) PICTT where the plasmon dephases with the direct creation of an electron in the CB of the semiconductor and a hole in the metal. VB indicates the semiconductor valence band, while is the energy of the incident photon. Reprinted with permission from Ref [134] Copyright The American Association for the Advancement of Science (2015).
Figure 7
Figure 7
Schematic of XPS depth profile characterization. XPS and UPS are both based on the photoelectric effect, where an incident X-ray or UV photon of energy is absorbed by an atom resulting in the emission of a photoelectron. This photoelectron is of binding energy Eb and is ejected with a kinetic energy Ek, such that Ek = hν − Eb − φ, where h is Planck’s constant and φ is the work function. In (a) the spectra of a 10 nm thin layer of Ag on a TiO2 film is measured during etching using an Ar ion gun (at 2 kV and 1 mA) 6 times at intervals of 10 s, the result being a map of the depth profile (b) of the Ag film on the TiO2 layer where the atomic compositions are displayed in percentile measures along with their energy level occupancies [154]. Reprinted with permission from Ref [154] Copyright American Chemical Society (2014).
Figure 8
Figure 8
Kar et al. [155] utilized UPS to characterize band energetics in their work on enhanced CH4 yield via photocatalytic CO2 reduction using TiO2 nanotube arrays (TNAs) grafted with Au, Ru, and ZnPd nanoparticles (NP). In (a) the work functions of Au-TNA, Ru-TNA, and ZnPd-TNA are extracted to equal 4.50, 4.66, and 3.81 eV, respectively. In order to determine the positions of the valence band maxima for each structure, (b) UPS high binding energy cut-off spectra are utilized with cut-off energies at 3.20, 2.75, and 2.97 eV in Au-TNA, Ru-TNA, and ZnPd-TNA, respectively. The importance of these measurements is illustrated in (c), where the band structures of the noble metal–semiconductor composites are elucidated. Since a He laser of incident energy 21.21 eV was utilized, the work function can be calculated from the expression 21.21—Ecut-off, where Ecut-off is the cut-off energy. Given the earlier values found in (a,b), the band-bending at the NP-TNA interfaces is measured. Thus, the UPS spectra assist in the significant observation of the differing band bending dynamics that occur in TNAs in contact with Ru NPs (upward bending) and TNAs in contact with ZnPd NPs (downward bending). This is particularly helpful in facilitating hypotheses and discussions on the charge transfer dynamics that may occur in such composite systems involving metal NP co-catalysts on metal oxide semiconductor supports, and their subsequent use as potential photocatalysts for a variety of chemical reactions. Reprinted with permission from Ref [155] Copyright Springer Nature (2016).
Figure 9
Figure 9
Applying XPS to a gold photosensitized SrTiO3 system used for visible-light water oxidation via Au interband transitions [158]. (a) The use of XPS allows for the measurement of the oxidative potential of holes leaving the plasmonic metal (Au) during interband transitions, and provides a confirmation of the valence band maximum of SrTiO3 at 3.20 eV below the Fermi level. The band edge of the Au nanopowders can also be identified at 1.95 eV (5d- band edge) with the tail edge attributed to 6sp electrons. This helps in the construction of the band energy diagram of the plasmonic system in (b), where the CB minimum of SrTiO3 is around −0.3 V vs. NHE with the expected band bending after contact (0.3 eV); a basic illustration of the use of XPS methods to illuminate the energy structure of a given surface including measures of the energy distributions and potentials of the charge carriers involved. Reprinted with permission from Ref [158] Copyright Royal Society of Chemistry (2014).
Figure 10
Figure 10
The Two-Photon Photoemission (2PPE) process. (a) Energy diagram for 2PPE of an unoccupied initial interfacial state. Absorption of photon 1 helps populate an excited intermediate state with a hot carrier and the absorption of photon 2 provides additional energy for the hot carrier to escape above the vacuum energy level. (b) The 2PPE process applied for an initially occupied interfacial state. (c) Schematic of the 2PPE experimental apparatus using a tunable femtosecond laser. Reprinted with permission from Ref [159] Copyright Elsevier (2005).
Figure 11
Figure 11
Characterization of Heterojunction Plasmons. (a) Deposition of Ag onto TiO2 is shown to enhance 2PP yields and consequently modifies the spectra of the s- and p-polarized excitations. The work function of the sample is noted to decrease around 0.35 eV, shifting the onset photoemission energy. (b) The 2PP yields are determined by integrating the photoelectrons counts with respect to the final photoelectron energy Ef and are plotted as a function of the change in the work function, which is dependent on the depth of Ag coverage. (c) A schematic portraying the enhancements of the 2PP yield with respect to the incident laser wavelength polarization and crystal azimuth orientation. p-polarized light has both the parallel and perpendicular electric field components, while the s-polarized light consists only of the parallel component. (d) Wavelength dependence of the 2PP enhancement by the parallel and perpendicular plasmon modes at energies 3.1 and 3.8 eV. This is determined by taking the ratio of p- to s-polarization yields (right y axis) and Ag/TiO2 to Mo (a polycrystalline Molybdenum sample that assumes a flat spectral response) yields. Reprinted with permission from Ref [161] Copyright Springer Nature (2017).
Figure 12
Figure 12
The Auger Effect, where we begin with a high-speed electron that knocks off an electron in the inner shell of an atom [157]. This leaves a vacant state (a 1s core hole), that is either filled by an upper electron that drops down to the inner shell, emitting a photon in the process (for heavy atoms, this energy is in the X-ray region, and thus results in X-ray fluorescence) or the excited ion relaxes by filling the core hole with an electron from a higher energy level, the resultant energy of this transition is taken up by an outer electron ejecting it from the atom, the Auger electron. The same is observed in the schematic where in non-resonant Auger spectroscopy, these vacancies are produced due to bombardment of a given sample with high energy electrons, in this case, a non-resonant X-ray pulse. Reprinted and adapted with permission from Ref [157] Copyright American Chemical Society (2016).
Figure 13
Figure 13
Using a combination of EELS with Scanning Tunneling Electron Microscopy (STEM) high-angle annular dark field (HAADF) imaging, Herzing et al. [168] determined the plasmon resonance characteristics of refractory TiN thin films. The spectra were collected by traversing (a) the yellow line from the MgO substrate through the TiN thin film, and to the opposite protective Pt layer. The spectra (b) are integrated over ten pixels at the locations of each colored arrow and indicate the local inelastic scattering distribution at said locations. From this, the spectral features typical of the MgO substrate are noted with an increase in inelastic scattering at 7.5 eV. At the interface of the MgO, and TiN film, a sharp peak due to surface-plasmon scattering is observed. A bulk plasmon resonance is identified at 2.81 eV and a weaker surface plasmon resonance peak was detected at 2.05 eV. The results are further supplemented by comparisons to finite difference time-domain simulations based on the measured optical data, which provide bulk and surface plasmon resonances with reasonable agreement at 2.74 eV and 2.15 eV, respectively. Reprinted with permission from Ref [168] Copyright Elsevier (2016).
Figure 14
Figure 14
One application of plasmonic photocatalysis is to help extend the optical absorption capabilities of semiconductor photocatalysts, such as TiO2 (that largely absorb in the UV-Vis range) to visible photons. LSPR peaks in the visible spectral range for various cross-architectures of Ag/TiO2 plasmonic nanostructures (Left), as utilized in the work of Zhao et al. [176] Reprinted with permission from Ref [176] with attribution and adherence to Creative Commons Attribution License (CC BY) 4.0. Similarly, Castillo et al. [177] present (Right, (a)) the UV-vis-NIR spectra of free Au nanoparticles of varying structures from nanospheres (black), nanostars (blue), and nanorods (red), along with that of the UV-vis-NIR spectra of the same Au nanoparticles after they are adsorbed onto SiO2 beads following coating with TiO2 nanoparticles: SiO2@Au nanospheres@TiO2 (black), SiO2@Au nanostars@TiO2 (blue), and SiO2@Au nanorods@TiO2 (red). Thus, they are able to identify the unique absorption signatures of the three different morphologies along with a host of other properties including the locations of plasmon modes as evidenced by the peaks, and the fact that the UV-vis spectra of the composite structures (Right, (b)) display strong absorption bands at longer wavelengths. Reprinted with permission from Ref [177] Copyright American Chemical Society (2016).
Figure 15
Figure 15
Another application of UV-Vis spectroscopy to characterize the dependence of plasmon resonance sensitivity on the geometry and morphology of the plasmonic system. UV-vis spectra of gold nanorods with aspect ratios varying between 1.7 to 6.8 along with the TEM images corresponding to each are shown. As is observed, the plasmon resonance of a gold nanorod can be tuned across the solar spectrum by controlling its nanogeometry. This has potential in the fabrication of composite, panchromatic plasmonic systems that ideally provide for broad and uniform absorption properties across the visible portion of the solar spectrum [178]. Reprinted with permission from Ref [178] Copyright American Chemical Society (2015).
Figure 16
Figure 16
Photoluminescence is a useful technique to probe electronic interactions in plasmonic nanostructures, including the nature of defects, kinetics of charge recombination, and the migration of photogenerated charge carriers, as presented in the work of Paul et al. [194] (a) shows a comparison of PL spectra of pure TiO2 with that of the composite Ag–TiO2 excited using a 355 nm laser. It is noted that the PL intensity is highly reduced in the heterostructure, due to the introduction of Ag nanoparticles. Gaussian fitted PL spectra of TiO2 nanorods and the Ag–TiO2 heterostructure are respectively shown in (b,c). The PL intensity of the TiO2 nanorods is also seen to have decreased by ~3 times after decoration by Ag nanoparticles, while the PL spectra remain the same. By identifying the centers of the deconvoluted peaks in (b,c), Paul et al. are able to elicit the different characteristics of the given samples, such as self-trapped excitons at the TiO2 octahedra (Peak 1), shallow traps involving Ti3+ states below the conduction band (Peak 2), deep trap states associated with single electron trapped oxygen vacancies (Peak 3), and an intrinsic defect (Peak 4). Lastly, (d) provides a comparison of time-resolved photoluminescence spectra of pure TiO2 nanorods and the Ag–TiO2 heterostructure at 471 nm (emission) with 375 nm excitation. From this the lifetime of charge carriers in the different samples can be measured. Reprinted with permission from Ref [194] Copyright American Chemical Society (2017).
Figure 17
Figure 17
Two photon luminescence studies of Anodic Plasmonic Au–TiO2 Engineered Nanocomposites (A-PLATENs) [195]. The experimental setup (a) utilized by Farsinezhad et al. to obtain the (b) two-photon luminescence spectra from A-PLATENS. Two-photon luminescence images obtained (c) using a confocal microscope display the enhancement obtained with the novel A-PLATENs structures as compared to regular anodic titania nanotubes and anodic TiO2 nanotubes decorated with Au nanoparticles using conventional techniques, under identical excitation and imaging conditions. The two-photon luminescence intensity (d) as a function of fluence of an exciting laser for TiAu film stacks. Reprinted with permission from Ref [195] Copyright American Chemical Society (2017).
Figure 18
Figure 18
(a) Schematic of the Raman effect as utilized in Ember et al. [204] The shifting modes of inelastic scattering often evinced in Raman spectroscopy from the Stokes band (Left), where an inelastic vibration is excited to the anti-Stokes band (Right), where an already excited vibrational state is de-excited, the latter resulting in a higher energy photon being emitted as opposed to the former. Lastly, is the case of the Rayleigh band (Center) where the light scattered by the sample is done so without any loss of energy. Reprinted and adapted with permission and no modifications from Ref [204] with attribution and adherence to Creative Commons Attribution License (CC BY) 4.0. Copyright Nature Publishing Group (2017). (b) Raman spectroscopy as a characterization method. Raman studies of TiO2, Ag–TiO2, Au–TiO2, and Ag on Au–TiO2 composites. As discussed in Patra et al. [205], active Raman modes at particular wavelengths allow for the confirmation of the characteristic features of anatase TiO2, as well as the confirmation of SERS resulting in frequency shifts between SERS and normal Raman spectra of molecules observed in the peak shifts and broadening after deposition of gold on TiO2 for the differing composite systems. Reprinted with permission from Ref [205] Copyright John Wiley and Sons (2016).
Figure 19
Figure 19
SERS as a probe to measure localized phonon temperatures of metal nanoparticles and vibrational adsorbate temperatures. Linic et al. [117] in (a) the temperature of the Ag nanoparticles under illumination by two laser sources (532 nm and 785 nm) are shown. Anti-Stokes spectra for the same is presented in the inset, along with temperatures of prominent vibrational modes of MB adsorbed on Ag (b), and the Stokes (red) and anti-Stokes (blue) spectra for the Ag–MB plasmonic system. There is a high anti-Stokes signal under 785 nm laser illumination (c) due to resonant charge transfer. The strong elevation in vibrational temperature of the adsorbed MB molecules under 785 nm laser illumination indicates resonant charge transfer from Ag to MB, while the similar temperatures of the Ag and the MB molecule under 532 nm laser illumination (d) indicates a lack of charge transfer, and a system in thermal equilibrium. Reprinted with permission from Ref [117] Copyright American Chemical Society (2016).
Figure 20
Figure 20
Using KPFM, Jian et al. [217] are able to study the modulation of the surface potential as a function of the light of power. (ac) It is observed that with increasing light power toward the LSPR wavelength, more electrons are excited and flow to the Au nanoparticles resulting in a decrease in the surface potential of the Au nanoparticle. This switches upon the start of LSPR absorption resulting in a potential rise from −36 mV to 30 mV and gradual saturation at longer wavelengths. (d) Narrow band-pass filters of visible light for six central wavelengths: 405 nm, 430 nm, 470 nm, 520 nm, 590 nm, and 780 nm corresponding to characteristics of the absorption spectrum of Au nanoparticles (the dip, the low absorption peak, LSPR absorption, LSPR peak, end of LSPR absorption, and the long wavelength side). Reprinted with permission from Ref. [217] Copyright Elsevier (2019).
Figure 21
Figure 21
Photocatalytic degradation of organic pollutants [240]. In this case (Left), a suitable semiconductor, such as TiO2 can be used, the schematic presenting the oxidation of possible organic pollutants. The excitation of electron hole pairs results in their migration to the surface of the semiconductor, where oxidation reduction reactions can take place. Oxygen molecules capture electrons from the conduction band forming oxide radicals (O2), which subsequently reacts with protons forming a hydroperoxide radical in (HO2). Together these radicals assist in the degradation of organic pollutants. A similar notion of degradation is also evidenced on the side of the valence band, where holes are extracted. Reprinted with permission from Ref [240] Copyright Elsevier (2005). (Right) Schematic diagram of charge separation in a visible light irradiated Ag/AgCl/TiO2 system. Reprinted with permission from Ref [242] Copyright American Chemical Society (2009).
Figure 22
Figure 22
(Top) Comparison of photocatalytic activity and decomposition of Methyl Orange in Water of samples of (a) anatase TiO2 (b) amorphous Ag/AgCl/TiO2 (c) anatase Ag/AgCl/TiO2 and (d) anatase TiO2−xNx. (Bottom) Cyclic degradation curve for anatase Ag/AgCl/TiO2. Reprinted with permission from Ref [242] Copyright American Chemical Society (2009).
Figure 23
Figure 23
Hydrogen generation comparisons using samples with differing coating thicknesses of TiO2 on Au/TiO2 nanocrystal arrays and bare TiO2 thin films under (a) UV irradiation (Hg lamp), and (b) visible-light irradiation (Xe lamp) [268]. Approximating roughly by eye, under UV light, 40 nm Au TiO2 nanocrystal arrays generate ~90,000 µmol of hydrogen while 10 nm Au TiO2 nanocrystal arrays generate ~37,000 µmol of hydrogen after 8 h, respectively. Under similar conditions, the 40 nm and 10 nm bare TiO2 films generate ~60,000 µmol and 17,000 µmol. On the other hand, under visible radiation, the hydrogen production from the bare TiO2 thin films is largely negligible, while the 40 nm and 10 nm Au TiO2 nanocrystal arrays generate ~12,000 µmol and 45,000 µmol of hydrogen after 8 h. Essentially, compared to bare TiO2 films, the Au/TiO2 nanocrystal arrays present higher photocatalytic activity. Reprinted with permission from Ref [268] Copyright Elsevier (2016).
Figure 24
Figure 24
(Top, (a)) Schematic of the water splitting system using a wide bandgap TiO2 semiconductor photoelectrode and a Pt counter electrode demonstrated by Fujishima and Honda in their landmark work in 1972. Adapted with permission from Ref [50] Copyright Nature Publishing Group (1972). (Bottom, (b)) Photocurrent measurements made on TiO2–Pd nanosheet and nanotetrahedron samples and compared to that of bare TiO2 samples. The higher photocurrent of TiO2–Pd nanosheets confirms plasmonic hot electron injection, while there is not too much difference in photocurrent magnitudes between bare TiO2 and TiO2–Pd nanotetrahedrons. This provides evidence of the poor hot electron injection abilities of Pd nanotetrahedrons as compared to Pd nanosheets. (c) Hydrogen production rates under vis-NIR light irradiation are shown, and as can be seen the TiO2–Pd nanosheets exhibit photocatalytic hydrogen evolution activity unlike bare TiO2 and TiO2–Pd nanotetrahedrons [271]. These experiments provide simple insights on the application of hot electrons in photoelectrochemical water splitting. Reprinted with permission from Ref [271] Copyright Royal Society of Chemistry (2016).
Figure 25
Figure 25
Photocatalytic hydrogen evolution, as presented by Wang et al. [280] for bare and composite bowl nanoarray and nanoparticle structures including TiO2, N-doped TiO2, Au-nanoparticles-confined n-doped TiO2 under different irradiation conditions (UV, Visible, and full-spectrum light): (a) for structures annealed in NH3, (b) for structures annealed in N2, and (c) for un-doped structures. (d) In all cases the plasmonic composite bowl nanoarray structures provide higher H2 production rates as opposed to the bare counterparts in TiO2, and N-doped TiO2 photocatalysts. Reprinted with permission from Ref [280] Copyright Elsevier (2016).
Figure 26
Figure 26
(a) A study of the apparent quantum efficiencies, by Liu et al. [158], to determine the driving force in photocatalysis of O2 evolution on 1.1% Au/SrTiO3 at various wavelengths of light. The important observation from these results being that water oxidation over the Au/SrTiO3 composite is not driven primarily by LSPR related phenomena. This is noted by the fact that the AQE curve for O2 evolution bears a strong resemblance to that of interband transitions suggesting that the visible light photosensitization effect of Au arises mainly from interband transitions. This fact is further supported in the results by the substantially negligible O2 evolution over Ag/SrTiO3 under visible light [158] as interband transitions of Ag are excited only in the UV spectrum through plasmon resonance, and observed in the visible region. Reprinted with permission from Ref [158] Copyright Royal Society of Chemistry (2014). (b) Shows the quantum efficiencies at a bias of 0 V vs Ag/AgCl for photoelectrochemical water splitting using plasmonic gold nanoparticle decorated TiO2 nanowires and gold nanorod decorated TiO2 nanowires, which follow the LSPR absorption profile. Reprinted with permission from Ref [286] Copyright American Chemical Society (2013).
Figure 27
Figure 27
Comparing the PEC properties of four different photoanodes: TiO2 nanorods (dark purple solid line), TiO2 nanorod photonic crystals (green solid line), Au/TiO2 nanorods (pink solid line), and Au/TiO2 nanorod photonic crystals (pale purple solid line) [257]. (a) Chronoamperometry measurements performed at an external potential of 1 V vs. Reversible Hydrogen Electrode (RHE). The on/off circles indicate simulated sunlight illumination. (b) Linear sweep voltammetry measurements for a scan rate of 50 mV/s under dark (dotted lines) and illuminated conditions. (c) Photoconversion efficiency as a function of applied potential versus RHE. (d) The resultant evolution of H2 and O2 gases for the four photoanodes under simulated sunlight illumination. Of particular note are the IPCE results in (e) which displays the shapes of the IPCE active spectra of the various Au/TiO2 composite photoanodes. PEC activity within the visible light regime is observed due to the presence of the Au noble metal nanoparticles. Furthermore, the shapes of the IPCE spectra as shown in the inset are noted to be similar to that of LSPR absorption spectra of Au nanoparticles. (f) Amperometric I-t curves for the four different photoanodes for repeated on-off cycles of simulated sunlight. Reprinted with permission from Ref [257] Copyright Royal Society of Chemistry (2014).

Similar articles

Cited by

References

    1. Kalyanasundaram K., Graetzel M. Artificial photosynthesis: Biomimetic approaches to solar energy conversion and storage. Curr. Opin. Biotechnol. 2010;21:298–310. doi: 10.1016/j.copbio.2010.03.021. - DOI - PubMed
    1. BP . BP Statistical Review of World Energy. BP; London, UK: 2018.
    1. International Energy Agency . Key World Energy Statistics. International Energy Agency; Paris, France: 2018.
    1. U.S. Energy Information Administration . International Energy Outlook. U.S. Energy Information Administration; Washington, DC, USA: 2010.
    1. Roy S.C., Varghese O.K., Paulose M., Grimes C.A. Toward solar fuels: Photocatalytic conversion of carbon dioxide to hydrocarbons. ACS Nano. 2010;4:1259–1278. doi: 10.1021/nn9015423. - DOI - PubMed

LinkOut - more resources