

Role of IQGAP1 in Papillomavirus-Associated Head and Neck Tumorigenesis
- PMID: 34068608
- PMCID: PMC8126105
- DOI: 10.3390/cancers13092276
Role of IQGAP1 in Papillomavirus-Associated Head and Neck Tumorigenesis
Abstract
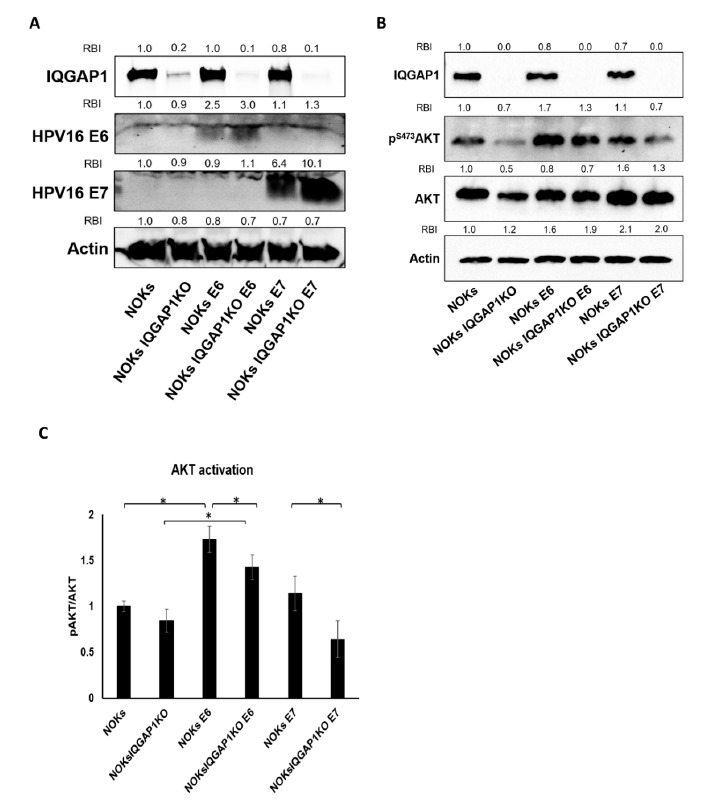
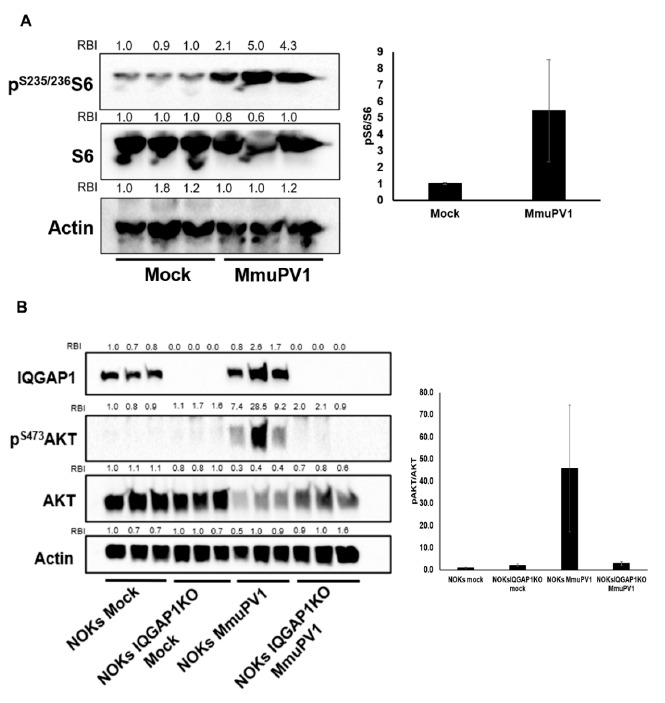
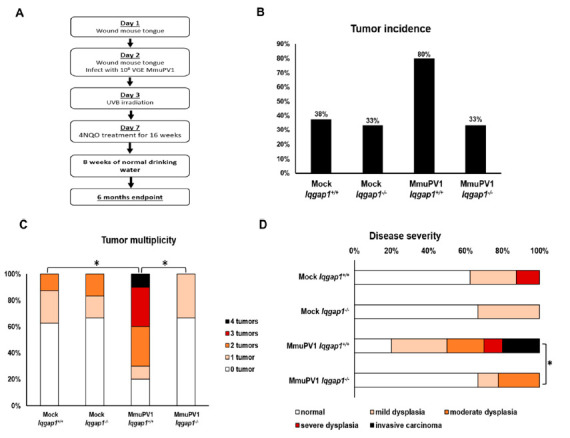
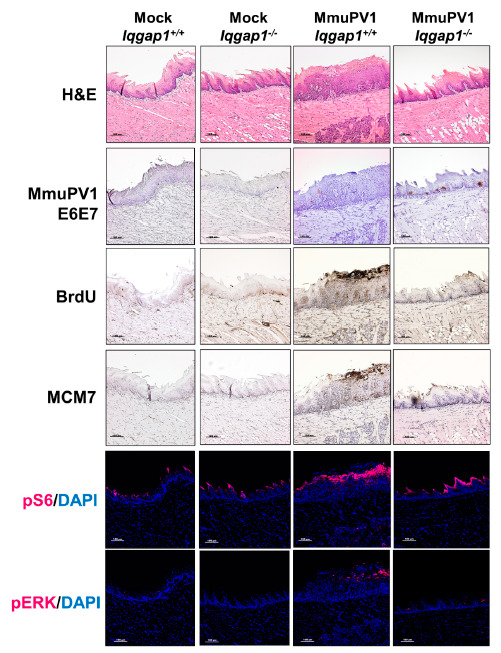
Approximately 25% of head and neck squamous cell carcinomas (HNSCC) are associated with human papillomavirus (HPV) infection. In these cancers as well as in HPV-associated anogenital cancers, PI3K signaling is highly activated. We previously showed that IQ motif-containing GTPase activating protein 1 (IQGAP1), a PI3K pathway scaffolding protein, is overexpressed in and contributes to HNSCC and that blocking IQGAP1-mediated PI3K signaling reduces HPV-positive HNSCC cell survival and migration. In this study, we tested whether IQGAP1 promotes papillomavirus (PV)-associated HNSCCs. IQGAP1 was necessary for optimal PI3K signaling induced by HPV16 oncoproteins in transgenic mice and MmuPV1 infection, a mouse papillomavirus that causes HNSCC in mice. Furthermore, we found that, at 6 months post-infection, MmuPV1-infected Iqgap1-/- mice developed significantly less severe tumor phenotypes than MmuPV1-infected Iqgap1+/+ mice, indicating a role of IQGAP1 in MmuPV1-associated HNSCC. The tumors resulting from MmuPV1 infection showed features consistent with HPV infection and HPV-associated cancer. However, such IQGAP1-dependent effects on disease severity were not observed in an HPV16 transgenic mouse model for HNC. This may reflect that IQGAP1 plays a role in earlier stages of viral pathogenesis, or other activities of HPV16 oncogenes are more dominant in driving carcinogenesis than their influence on PI3K signaling.
Keywords: HPV; IQGAP1; MmuPV1; PI3K signaling; head and neck cancer; infection model; mouse model; papillomavirus.
Conflict of interest statement
The authors declare no conflict of interest.
Figures
Similar articles
-
A PI3K/AKT Scaffolding Protein, IQ Motif-Containing GTPase Associating Protein 1 (IQGAP1), Promotes Head and Neck Carcinogenesis.Clin Cancer Res. 2020 Jan 1;26(1):301-311. doi: 10.1158/1078-0432.CCR-19-1063. Epub 2019 Oct 9. Clin Cancer Res. 2020. PMID: 31597661 Free PMC article.
-
Monitoring mouse papillomavirus-associated cancer development using longitudinal Pap smear screening.mBio. 2024 Aug 14;15(8):e0142024. doi: 10.1128/mbio.01420-24. Epub 2024 Jul 16. mBio. 2024. PMID: 39012151 Free PMC article.
-
The Mus musculus Papillomavirus Type 1 E7 Protein Binds to the Retinoblastoma Tumor Suppressor: Implications for Viral Pathogenesis.mBio. 2021 Aug 31;12(4):e0227721. doi: 10.1128/mBio.02277-21. Epub 2021 Aug 31. mBio. 2021. PMID: 34465025 Free PMC article.
-
Prophylactic vaccination against human papillomaviruses to prevent cervical cancer and its precursors.Cochrane Database Syst Rev. 2018 May 9;5(5):CD009069. doi: 10.1002/14651858.CD009069.pub3. Cochrane Database Syst Rev. 2018. PMID: 29740819 Free PMC article.
-
Systemic pharmacological treatments for chronic plaque psoriasis: a network meta-analysis.Cochrane Database Syst Rev. 2021 Apr 19;4(4):CD011535. doi: 10.1002/14651858.CD011535.pub4. Cochrane Database Syst Rev. 2021. Update in: Cochrane Database Syst Rev. 2022 May 23;5:CD011535. doi: 10.1002/14651858.CD011535.pub5. PMID: 33871055 Free PMC article. Updated.
Cited by
-
IQGAP1 and RNA Splicing in the Context of Head and Neck via Phosphoproteomics.J Proteome Res. 2022 Sep 2;21(9):2211-2223. doi: 10.1021/acs.jproteome.2c00309. Epub 2022 Aug 18. J Proteome Res. 2022. PMID: 35980772 Free PMC article.
-
Role of IQ Motif-Containing GTPase-Activating Proteins in Hepatocellular Carcinoma.Front Oncol. 2022 Jun 16;12:920652. doi: 10.3389/fonc.2022.920652. eCollection 2022. Front Oncol. 2022. PMID: 35785216 Free PMC article. Review.
-
Role of IQGAP1 in Carcinogenesis.Cancers (Basel). 2021 Aug 4;13(16):3940. doi: 10.3390/cancers13163940. Cancers (Basel). 2021. PMID: 34439095 Free PMC article. Review.
-
The scaffolding protein IQGAP1 enhances EGFR signaling by promoting oligomerization and preventing degradation.J Biol Chem. 2024 Nov;300(11):107844. doi: 10.1016/j.jbc.2024.107844. Epub 2024 Sep 30. J Biol Chem. 2024. PMID: 39357822 Free PMC article.
-
Molecular Mechanisms of MmuPV1 E6 and E7 and Implications for Human Disease.Viruses. 2022 Sep 28;14(10):2138. doi: 10.3390/v14102138. Viruses. 2022. PMID: 36298698 Free PMC article. Review.
References
-
- Cancer Facts and Figures 2019. American Cancer Society; Atlanta, GA, USA: 2019.
Grants and funding
LinkOut - more resources
Full Text Sources
Research Materials
Miscellaneous
