

Validation of a Visual-Based Analytics Tool for Outcome Prediction in Polytrauma Patients (WATSON Trauma Pathway Explorer) and Comparison with the Predictive Values of TRISS
- PMID: 34068849
- PMCID: PMC8153591
- DOI: 10.3390/jcm10102115
Validation of a Visual-Based Analytics Tool for Outcome Prediction in Polytrauma Patients (WATSON Trauma Pathway Explorer) and Comparison with the Predictive Values of TRISS
Abstract
Introduction: Big data-based artificial intelligence (AI) has become increasingly important in medicine and may be helpful in the future to predict diseases and outcomes. For severely injured patients, a new analytics tool has recently been developed (WATSON Trauma Pathway Explorer) to assess individual risk profiles early after trauma. We performed a validation of this tool and a comparison with the Trauma and Injury Severity Score (TRISS), an established trauma survival estimation score. Methods: Prospective data collection, level I trauma centre, 1 January 2018-31 December 2019.
Inclusion criteria: Primary admission for trauma, injury severity score (ISS) ≥ 16, age ≥ 16.
Parameters: Age, ISS, temperature, presence of head injury by the Glasgow Coma Scale (GCS).
Outcomes: SIRS and sepsis within 21 days and early death within 72 h after hospitalisation.
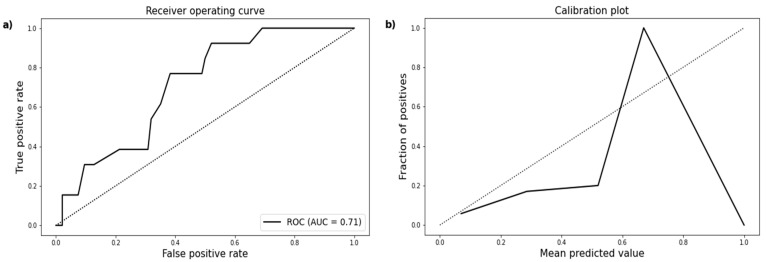
Statistics: Area under the receiver operating characteristic (ROC) curve for predictive quality, calibration plots for graphical goodness of fit, Brier score for overall performance of WATSON and TRISS. Results: Between 2018 and 2019, 107 patients were included (33 female, 74 male; mean age 48.3 ± 19.7; mean temperature 35.9 ± 1.3; median ISS 30, IQR 23-36). The area under the curve (AUC) is 0.77 (95% CI 0.68-0.85) for SIRS and 0.71 (95% CI 0.58-0.83) for sepsis. WATSON and TRISS showed similar AUCs to predict early death (AUC 0.90, 95% CI 0.79-0.99 vs. AUC 0.88, 95% CI 0.77-0.97; p = 0.75). The goodness of fit of WATSON (X2 = 8.19, Hosmer-Lemeshow p = 0.42) was superior to that of TRISS (X2 = 31.93, Hosmer-Lemeshow p < 0.05), as was the overall performance based on Brier score (0.06 vs. 0.11 points). Discussion: The validation supports previous reports in terms of feasibility of the WATSON Trauma Pathway Explorer and emphasises its relevance to predict SIRS, sepsis, and early death when compared with the TRISS method.
Keywords: SIRS; TRISS; WATSON Trauma Pathway Explorer; artificial intelligence; early death; outcome; polytrauma; sepsis.
Conflict of interest statement
All authors certify that they have no affiliations with or involvement in any organization or entity with any financial interest, or nonfinancial interest in the subject matter or materials discussed in this paper. C.N. und L.M share first authorship. The authors declare no conflict of interest related to the submitted study.
Figures


References
-
- Mica L., Niggli C., Bak P., Yaeli A., McClain M., Lawrie C.M., Pape H.C. Development of a Visual Analytics Tool for Polytrauma Patients: Proof of Concept for a New Assessment Tool Using a Multiple Layer Sankey Diagram in a Single-Center Database. World J. Surg. 2020;44:764–772. doi: 10.1007/s00268-019-05267-6. - DOI - PubMed
Grants and funding
LinkOut - more resources
Full Text Sources
