

The Impact of Weather and Seasons on Falls and Physical Activity among Older Adults with Glaucoma: A Longitudinal Prospective Cohort Study
- PMID: 34068938
- PMCID: PMC8156454
- DOI: 10.3390/s21103415
The Impact of Weather and Seasons on Falls and Physical Activity among Older Adults with Glaucoma: A Longitudinal Prospective Cohort Study
Abstract
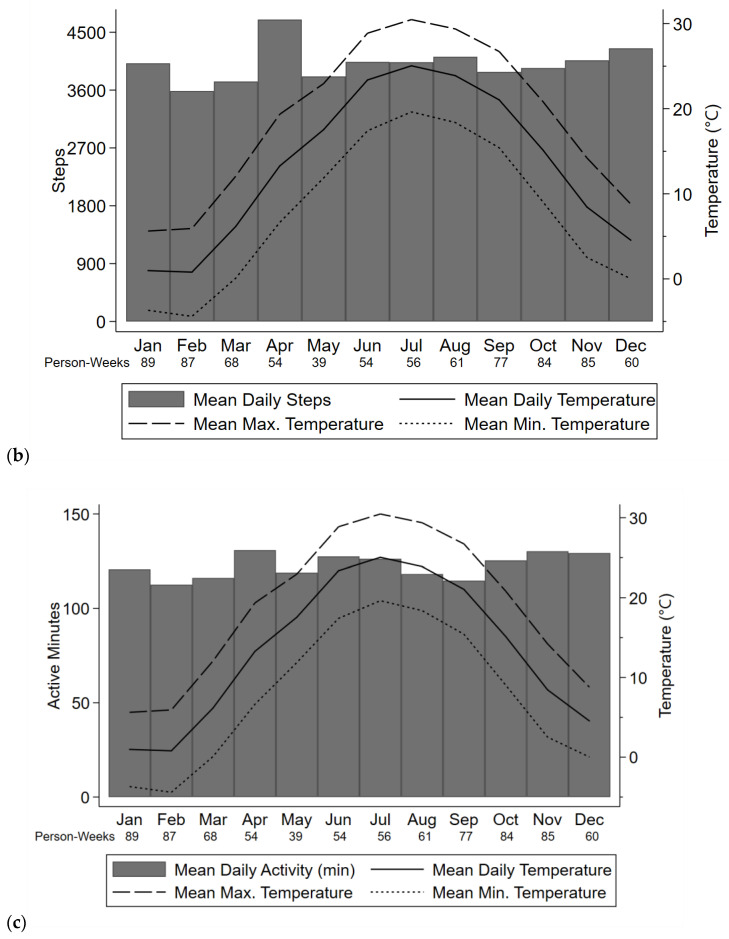
Understanding periods of the year associated with higher risk for falling and less physical activity may guide fall prevention and activity promotion for older adults. We examined the relationship between weather and seasons on falls and physical activity in a three-year cohort of older adults with glaucoma. Participants recorded falls information via monthly calendars and participated in four one-week accelerometer trials (baseline and per study year). Across 240 participants, there were 406 falls recorded over 7569 person-months, of which 163 were injurious (40%). In separate multivariable regression models incorporating generalized estimating equations, temperature, precipitation, and seasons were not significantly associated with the odds of falling, average daily steps, or average daily active minutes. However, every 10 °C increase in average daily temperature was associated with 24% higher odds of a fall being injurious, as opposed to non-injurious (p = 0.04). The odds of an injurious fall occurring outdoors, as opposed to indoors, were greater with higher average temperatures (OR per 10 °C = 1.46, p = 0.03) and with the summer season (OR = 2.69 vs. winter, p = 0.03). Falls and physical activity should be understood as year-round issues for older adults, although the likelihood of injury and the location of fall-related injuries may change with warmer season and temperatures.
Keywords: accelerometer; falls; older adults; seasons; weather.
Conflict of interest statement
The authors declare no conflict of interest. The funders had no role in the design of the study, in the collection, analyses, or interpretation of data, in the writing of the manuscript, or in the decision to publish the results.
Figures


Similar articles
-
Characterizing the Impact of Fear of Falling on Activity and Falls in Older Adults with Glaucoma.J Am Geriatr Soc. 2020 Aug;68(8):1847-1851. doi: 10.1111/jgs.16516. Epub 2020 May 15. J Am Geriatr Soc. 2020. PMID: 32413186 Free PMC article.
-
Characterizing Longitudinal Changes in Physical Activity and Fear of Falling after Falls in Glaucoma.J Am Geriatr Soc. 2021 May;69(5):1249-1256. doi: 10.1111/jgs.17014. Epub 2021 Jan 8. J Am Geriatr Soc. 2021. PMID: 33418602 Free PMC article.
-
Evaluation of away-from-home excursion patterns after falling among individuals with glaucoma: a longitudinal study.BMC Geriatr. 2022 Feb 4;22(1):101. doi: 10.1186/s12877-022-02788-z. BMC Geriatr. 2022. PMID: 35120451 Free PMC article.
-
What Is a Falls Risk Factor? Factors Associated with Falls per Time or per Step in Individuals with Glaucoma.J Am Geriatr Soc. 2019 Jan;67(1):87-92. doi: 10.1111/jgs.15609. Epub 2018 Oct 26. J Am Geriatr Soc. 2019. PMID: 30365871 Free PMC article.
-
Assessing the effects of weather conditions on physical activity participation using objective measures.Int J Environ Res Public Health. 2009 Oct;6(10):2639-54. doi: 10.3390/ijerph6102639. Epub 2009 Oct 12. Int J Environ Res Public Health. 2009. PMID: 20054460 Free PMC article. Review.
Cited by
-
A National Study on the Comparative Burden of Pedestrian Injuries from Falls Relative to Pedestrian Injuries from Motor Vehicle Collisions.J Urban Health. 2024 Feb;101(1):181-192. doi: 10.1007/s11524-023-00815-x. Epub 2024 Jan 18. J Urban Health. 2024. PMID: 38236430 Free PMC article.
-
Relation of environmental factors with activity limitations and participation restrictions in older adults with diabetes mellitus over time: an international classification of functioning framework perspective.BMC Geriatr. 2023 May 30;23(1):335. doi: 10.1186/s12877-023-03977-0. BMC Geriatr. 2023. PMID: 37254057 Free PMC article.
-
A study on the falls factors among the older adult with cognitive impairment based on large-sample data.Front Public Health. 2024 Jun 14;12:1376993. doi: 10.3389/fpubh.2024.1376993. eCollection 2024. Front Public Health. 2024. PMID: 38947354 Free PMC article.
-
The Impact of Neighborhood Factors on Physical Activity in Older Adults With Visual Impairment.Am J Ophthalmol. 2023 Jun;250:49-58. doi: 10.1016/j.ajo.2023.01.017. Epub 2023 Jan 20. Am J Ophthalmol. 2023. PMID: 36682519 Free PMC article.
-
Risky Business: Factors That Increase Risk of Falls Among Older Adult In-Patients.Gerontol Geriatr Med. 2023 Jul 30;9:23337214231189930. doi: 10.1177/23337214231189930. eCollection 2023 Jan-Dec. Gerontol Geriatr Med. 2023. PMID: 37533770 Free PMC article.
References
-
- 10 Leading Causes of Injury Deaths by Age Group Highlighting Unintentional Injury Deaths, United States-2018. [(accessed on 30 July 2020)]; Available online: https://www.cdc.gov/injury/images/lc-charts/leading_causes_of_death_by_a....
-
- National Estimates of the 10 Leading Causes of Nonfatal Injuries Treated in Hospital Emergency Departments, United States-2017. [(accessed on 30 July 2020)]; Available online: https://www.cdc.gov/injury/images/lc-charts/leading_causes_of_nonfatal_i....
-
- Hartholt K.A., van Beeck E.F., Polinder S., van der Velde N., van Lieshout E.M.M., Panneman M.J.M., van der Cammen T.J.M., Patka P. Societal Consequences of Falls in the Older Population: Injuries, Healthcare Costs, and Long-Term Reduced Quality of Life. J. Trauma Inj. Infect. Crit. Care. 2011;71:748–753. doi: 10.1097/TA.0b013e3181f6f5e5. - DOI - PubMed
-
- Zijlstra G.A.R., van Haastregt J.C.M., van Eijk JThM I.E., van Rossum E., Stalenhoef P.A., Kempen G.I.J.M. Prevalence and Correlates of Fear of Falling, and Associated Avoidance of Activity in the General Population of Community-Living Older People. Age Ageing. 2007;36:304–309. doi: 10.1093/ageing/afm021. - DOI - PubMed
MeSH terms
Grants and funding
LinkOut - more resources
Full Text Sources
Medical
