. 2021 May 14;11(5):77.
doi: 10.3390/bs11050077.

Studying Behaviour Change Mechanisms under Complexity

Affiliations

Studying Behaviour Change Mechanisms under Complexity

Matti T J Heino et al. Behav Sci (Basel). .

Abstract

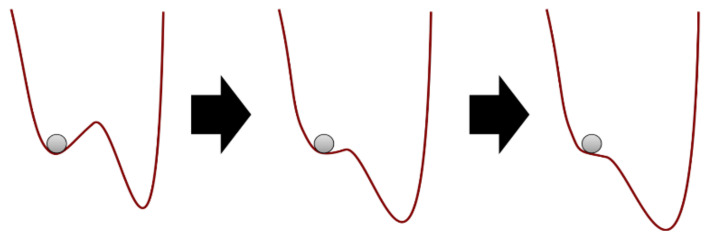
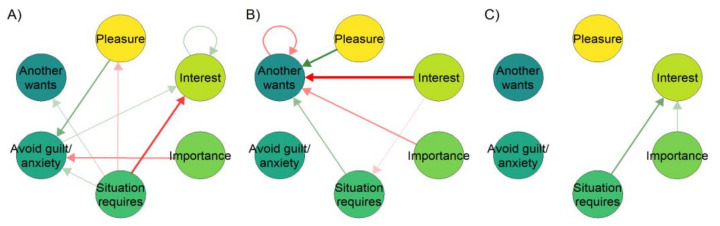
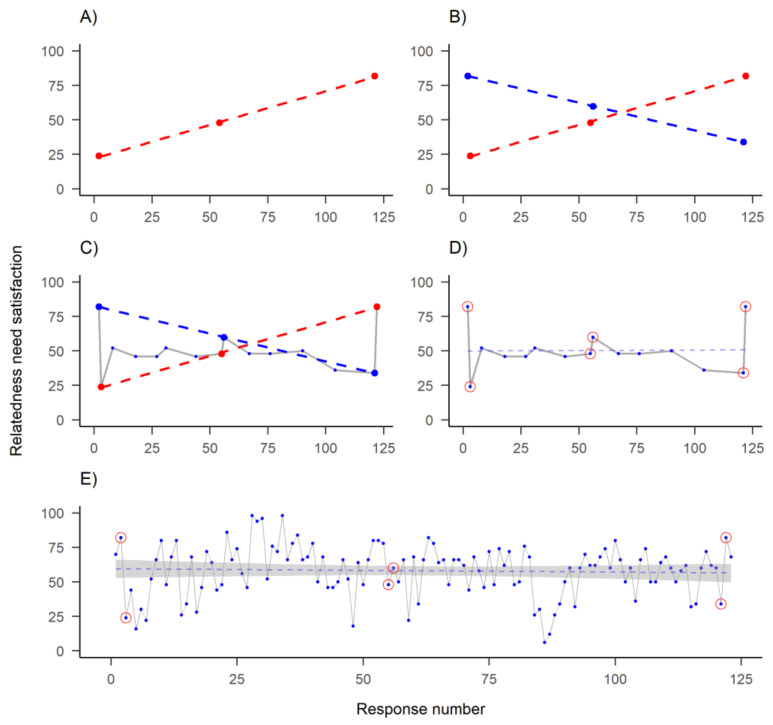
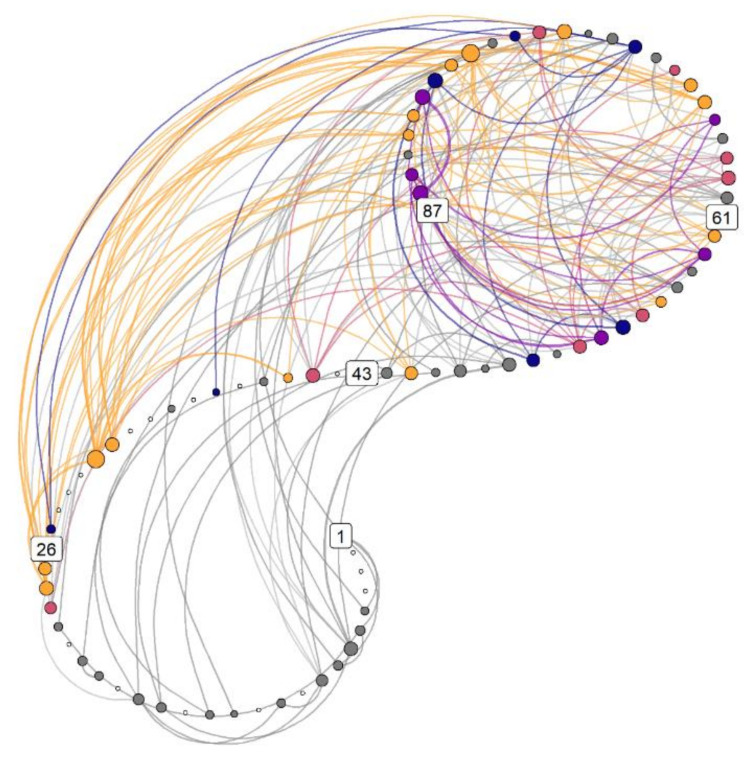
Understanding the mechanisms underlying the effects of behaviour change interventions is vital for accumulating valid scientific evidence, and useful to informing practice and policy-making across multiple domains. Traditional approaches to such evaluations have applied study designs and statistical models, which implicitly assume that change is linear, constant and caused by independent influences on behaviour (such as behaviour change techniques). This article illustrates limitations of these standard tools, and considers the benefits of adopting a complex adaptive systems approach to behaviour change research. It (1) outlines the complexity of behaviours and behaviour change interventions; (2) introduces readers to some key features of complex systems and how these relate to human behaviour change; and (3) provides suggestions for how researchers can better account for implications of complexity in analysing change mechanisms. We focus on three common features of complex systems (i.e., interconnectedness, non-ergodicity and non-linearity), and introduce Recurrence Analysis, a method for non-linear time series analysis which is able to quantify complex dynamics. The supplemental website provides exemplifying code and data for practical analysis applications. The complex adaptive systems approach can complement traditional investigations by opening up novel avenues for understanding and theorising about the dynamics of behaviour change.

Keywords: behaviour change; complex systems; methodology; wellbeing.


Conflict of interest statement

The authors declare no conflict of interest.

Figures

Figure 1
Figure 1
Evolution in attractor landscape: An intervention moulds a system, making it less stable, hence easier for the ball to move from current state (left) to another one (right). Alternatively, an intervention—or random events—can jolt the system over the ridge, i.e., a tipping point.
Figure 2
Figure 2
Relationships between a single participant’s motivational variables varying in time (time-varying autoregressive model). Networks represent relationships between variables around the time points where 10% (panel (A)), 50% (B) and 90% (C) of the study had been completed. An arrow from one variable to the next means the former predicts the latter at the next time point; green for positive and red for negative correlation. If a stationary model was used, all periods would be collapsed to a single result, creating the impression that the relationships were homogeneous across the study period. Although this temporal variability can be due to, e.g., changes in how the participant answers the questions (boredom, shifting perception of the items, etc.), or poor reliability of the measures, complexity theory would also guide us to expect that in very concrete reality, the direction and strength of relationships can shift over time and differ based on the state a person resides in. As an example, the relationships between motivational variables during behaviour change initiation phase, may differ from the relationships during the maintenance phase.
Figure 3
Figure 3
One of the time series recorded by the participant featured in previous figure. Dots indicate answers to a visual analog scale question on their relatedness need satisfaction, as posited by self-determination theory (y-axis), measured on different time points (x-axis): (A) Measuring three time points—representing conventional evaluation of baseline, post-intervention and a longer-term follow-up—shows a decreasing trend; (B) Same measurement on slightly different days shows an opposite trend; (C) Measuring 15 time points instead of 3 would have accommodated both observed “trends”; (D) New linear regression line (dashed) indicates stationarity and (E) Including all 122 time points, a more complete picture of the dynamics emerges.
Figure 4
Figure 4
Weighted multidimensional recurrence network. Each circle (“node”) is a measurement occasion, numbers indicate their running number, and colors represent different motivation profiles. These profiles are configurations of six variables, and can be conceived of as attractors. Lines indicate the same motivational state reoccurring at a later time point. Yellow nodes indicate configurations connecting to that with the highest strength centrality (i.e., number of connections weighted by the similarity of the connected nodes), red nodes connect to the second strongest configuration which is not connected to the strongest, followed by purple and blue. Grey nodes depict uncategorised configurations which occur at least twice, and white ones depict the configurations, which only occur once. Nodes that are larger have higher strength centrality. Drawn with R package casnet [131].
Figure 5
Figure 5
Main profiles corresponding to the colors indicated in the previous plot. See supplementary website (section available online: https://git.io/JfLmS (accessed on 1 May 2021)) for a thorough exposition.
Figure 6
Figure 6
Transitions between states. Panel (A). Percentages with which each state precedes the others. If the system is in the configuration labelled 1st, based on the relative frequencies of observed transitions, there is a 38% chance it stays in the same configuration, and a 25% chance it transitions to one of the uncategorised states—that is, states that are less strong than the state labelled 4th, but which appear more than once. Note that the zeroes do not signify this transition is impossible, only that it did not appear once during the data collection period. Columns may not sum to 100 due to rounding. Panel (B). Data from panel (A) represented as a transition network.

References

    1. Kwasnicka D., Dombrowski S.U., White M., Sniehotta F. Theoretical Explanations for Maintenance of Behaviour Change: A Systematic Review of Behaviour Theories. Health Psychol. Rev. 2016;10:277–296. doi: 10.1080/17437199.2016.1151372. - DOI - PMC - PubMed
    1. Carey R.N., Connell L.E., Johnston M., Rothman A.J., de Bruin M., Kelly M.P., Michie S. Behavior Change Techniques and Their Mechanisms of Action: A Synthesis of Links Described in Published Intervention Literature. Ann. Behav. Med. 2019;53:693–707. doi: 10.1093/abm/kay078. - DOI - PMC - PubMed
    1. Michie S., West R., Campbell R., Brown J., Gainforth H. ABC of Behaviour Change Theories. Silverback; Sutton, UK: 2014.
    1. Matthews L., Simpson S.A. Evaluation of Behavior Change Interventions. In: Hamilton K., Cameron L.D., Hagger M.S., Hankonen N., Lintunen T., editors. The Handbook of Behavior Change. Cambridge University Press; Cambridge, UK: 2020. pp. 318–332. Cambridge Handbooks in Psychology.
    1. Hagger M.S., Moyers S., McAnally K., McKinley L.E. Known Knowns and Known Unknowns on Behavior Change Interventions and Mechanisms of Action. Health Psychol. Rev. 2020;14:199–212. doi: 10.1080/17437199.2020.1719184. - DOI - PubMed

LinkOut - more resources