. 2021 May 14;9(5):506.
doi: 10.3390/vaccines9050506.

Strategies for Vaccine Prioritization and Mass Dispensing

Affiliations

Strategies for Vaccine Prioritization and Mass Dispensing

Eva K Lee et al. Vaccines (Basel). .

Abstract

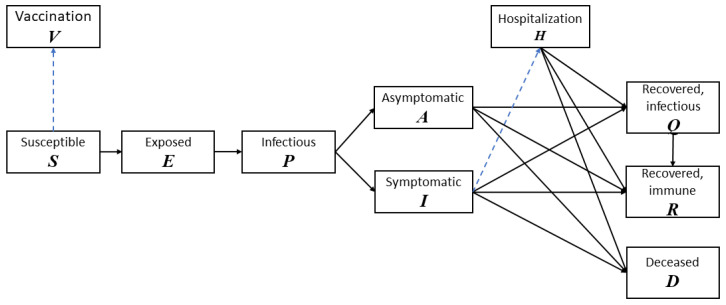
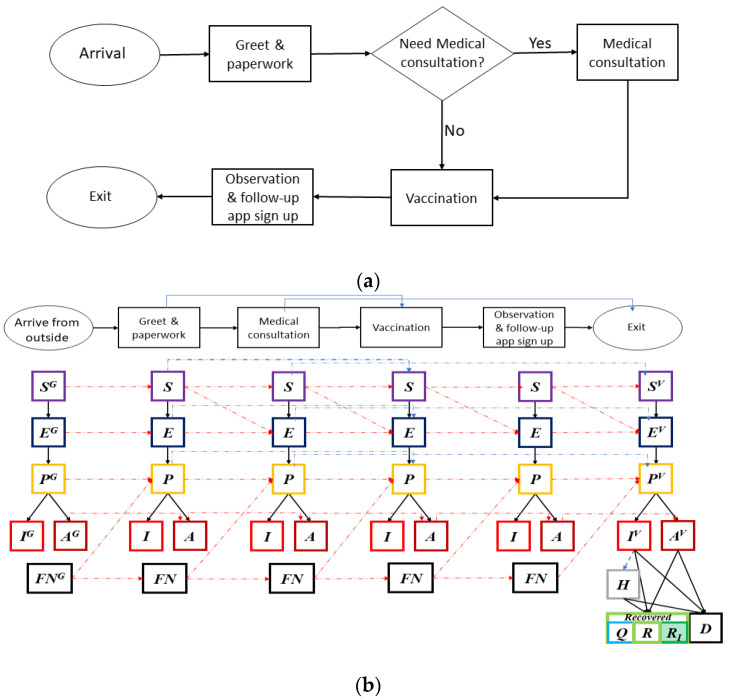
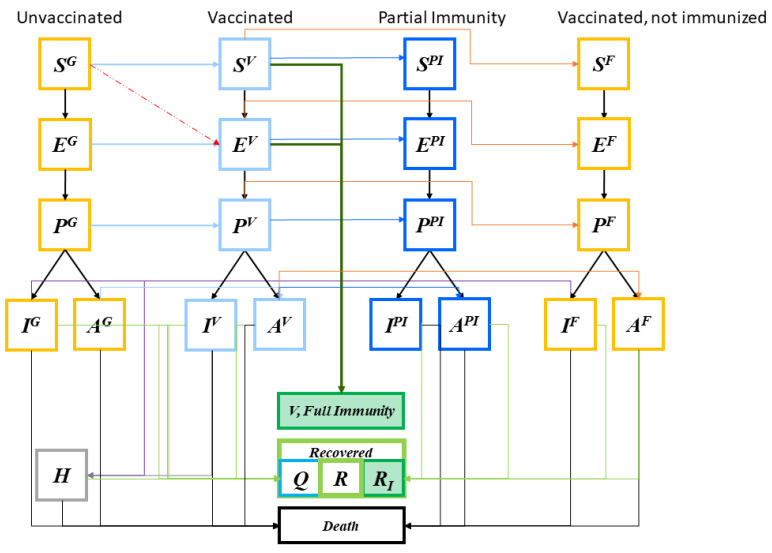
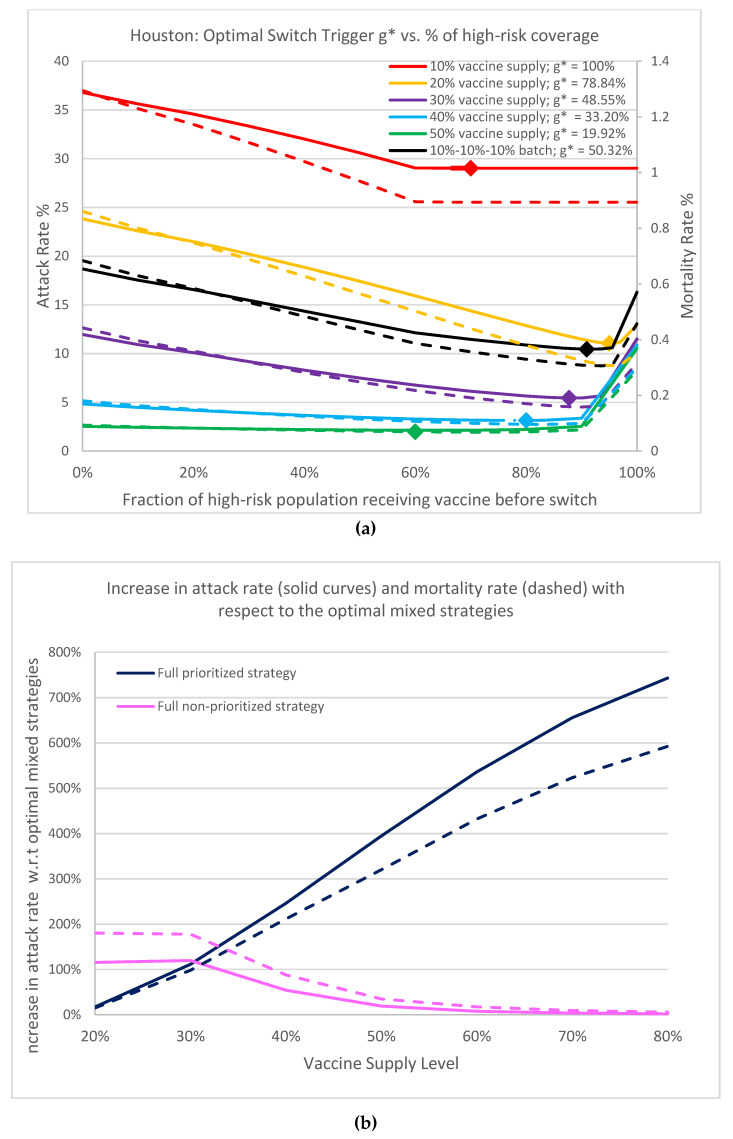
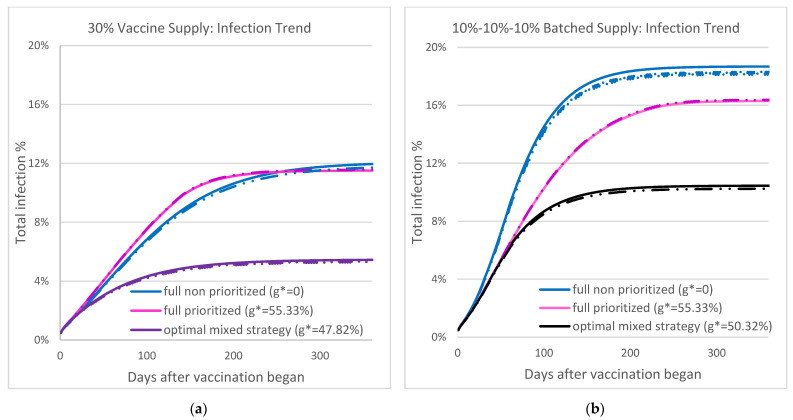
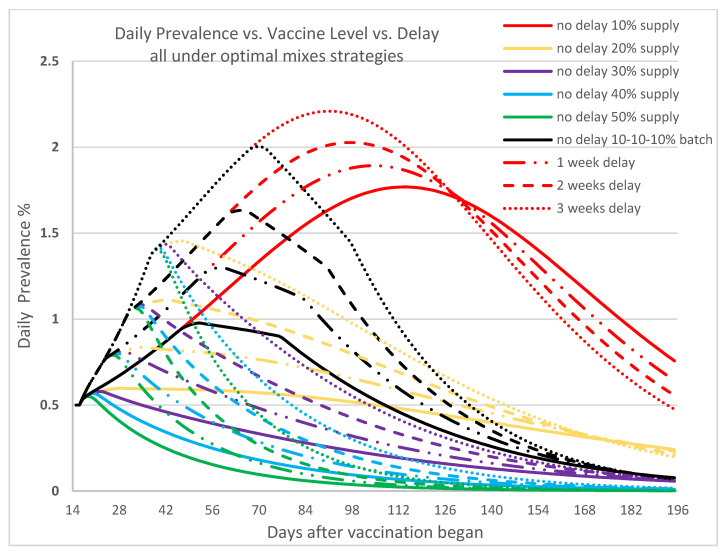
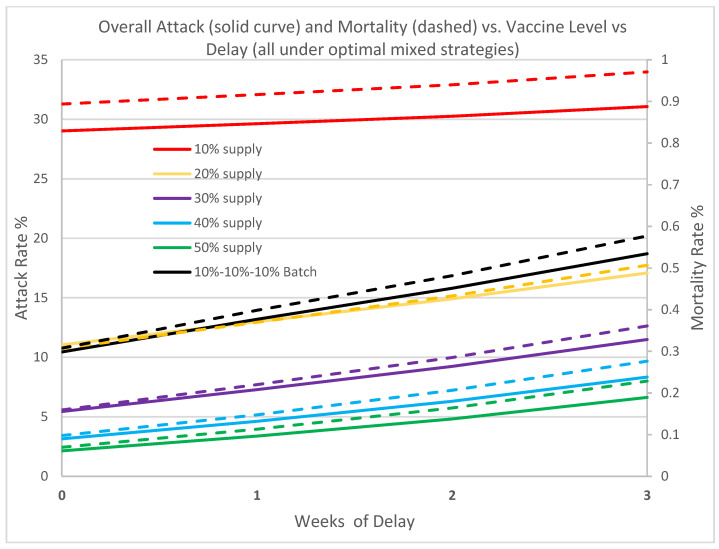
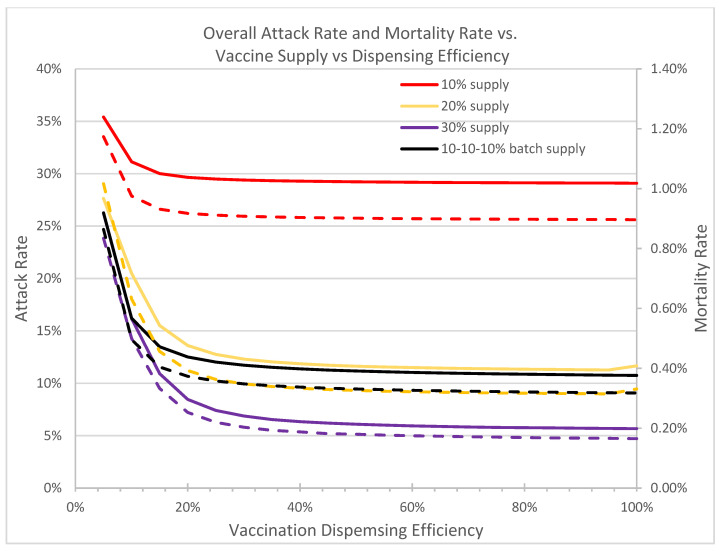
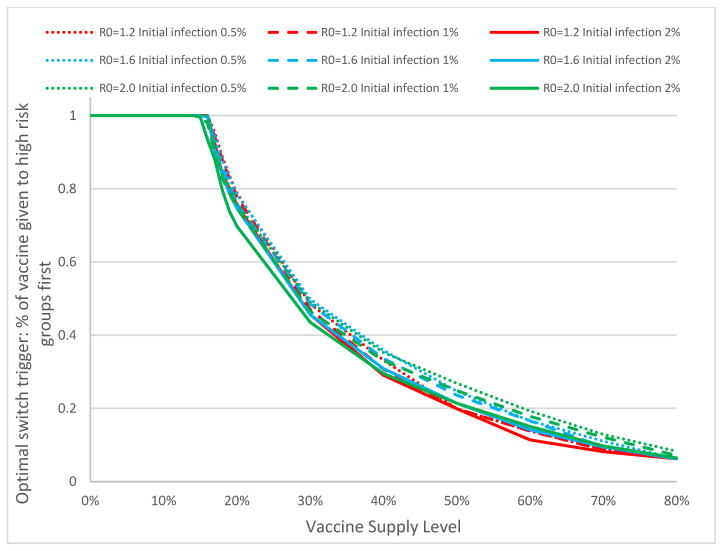
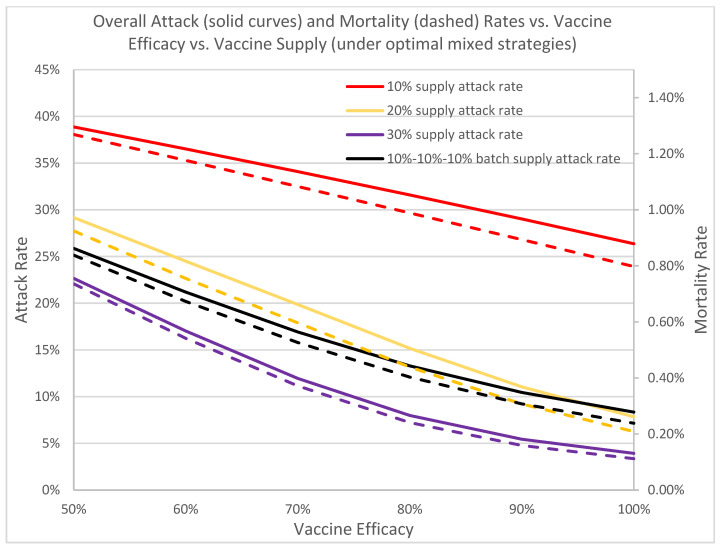
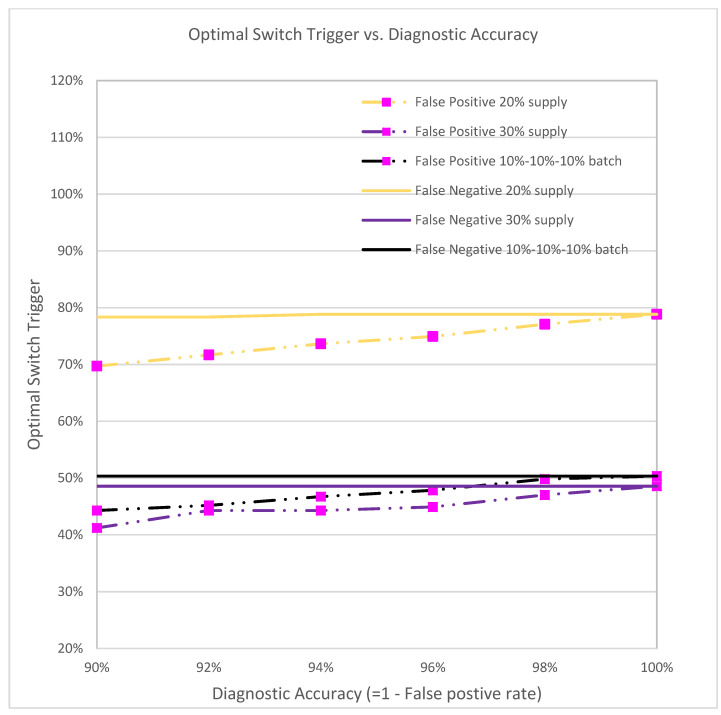
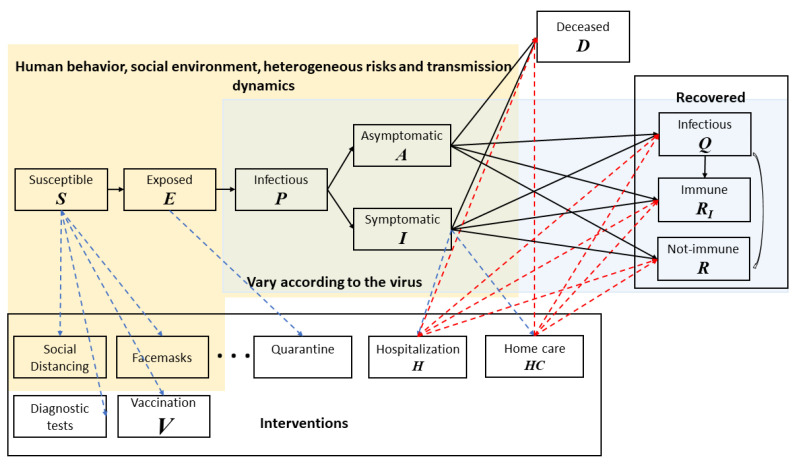
We propose a system that helps decision makers during a pandemic find, in real time, the mass vaccination strategies that best utilize limited medical resources to achieve fast containments and population protection. Our general-purpose framework integrates into a single computational platform a multi-purpose compartmental disease propagation model, a human behavior network, a resource logistics model, and a stochastic queueing model for vaccination operations. We apply the modeling framework to the current COVID-19 pandemic and derive an optimal trigger for switching from a prioritized vaccination strategy to a non-prioritized strategy so as to minimize the overall attack rate and mortality rate. When vaccine supply is limited, such a mixed vaccination strategy is broadly effective. Our analysis suggests that delays in vaccine supply and inefficiencies in vaccination delivery can substantially impede the containment effort. Employing an optimal mixed strategy can significantly reduce the attack and mortality rates. The more infectious the virus, the earlier it helps to open the vaccine to the public. As vaccine efficacy decreases, the attack and mortality rates rapidly increase by multiples; this highlights the importance of early vaccination to reduce spreading as quickly as possible to lower the chances for further mutations to evolve and to reduce the excessive healthcare burden. To maximize the protective effect of available vaccines, of equal importance are determining the optimal mixed strategy and implementing effective on-the-ground dispensing. The optimal mixed strategy is quite robust against variations in model parameters and can be implemented readily in practice. Studies with our holistic modeling framework strongly support the urgent need for early vaccination in combating the COVID-19 pandemic. Our framework permits rapid custom modeling in practice. Additionally, it is generalizable for different types of infectious disease outbreaks, whereby a user may determine for a given type the effects of different interventions including the optimal switch trigger.

Keywords: biological-behavior-logistics-queueing computational framework; mass vaccination; mixed vaccination strategy; switch trigger; vaccine efficacy; vaccine prioritization.


Conflict of interest statement

The authors declare no conflict of interest. The funders had no role in the design of the study; in the collection, analyses, or interpretation of data; in the writing of the manuscript, or in the decision to publish the results.

Figures

Figure 1
Figure 1
The stage transition diagram of our COVID-19 model. Solid lines are transitions associated with new infections and disease propagation. Dashed lines are transitions associated with vaccination and treatment.
Figure 2
Figure 2
(a) A process flowchart of the COVID-19 point-of-dispensing (POD) operations. The service time at each station is fitted with real-life time-motion studies from multiple vaccination events. (b) Disease stages of individuals within each station of the POD, their interplay and progression dynamics. A susceptible individual at a station may become exposed and move to “Exposed” disease stage in the next station. False negative (FN) individuals may have recovered from COVID-19; or a newly FN individual can become infectious at some point inside the POD. Recovered individuals can be recovered with immunity (RI) or recovered without immunity (R).
Figure 3
Figure 3
Immunity and disease stages of individuals upon vaccination. Individuals may become exposed to the disease during the vaccination process (red arrow). Once vaccinated, it typically takes a few weeks for the body to establish immunity against the virus. A person could still get COVID-19 just after vaccination (the light-blue disease progression). Some vaccinated people may develop only partial immunity and may contract disease still, although mostly with only mild or no symptoms at all (dark blue disease progression). A small percentage may fail to develop immunity.
Figure 4
Figure 4
(a) Plot of overall attack rate and mortality rate (evaluated on Day 360) as a function of percentage of high-risk coverage. R0=1.2. Red, yellow, purple, blue and green curves correspond to, respectively, 10%, 20%, 30%, 40% and 50% uninterrupted vaccine supply inventory. The black curves show the batched 30% vaccine supply with delay: 10% arrived on Day 0, Day 30, and Day 60. Solid curves denote attack rates, dashed denote mortality rates. Points marked on the curves indicate the associated optimal switch trigger. (b) This graph shows the rapid increase in attack rates (solid curves) and mortality rates (dashed curves) for full prioritized strategies with respect to the optimal mixed strategies as more vaccine becomes available. It also shows that there is more urgency to open up more vaccines to the general public.
Figure 5
Figure 5
The two figures show overall infection under three vaccination strategies—optimal mixed strategy, full prioritized, and full non-prioritized—when the vaccine supply level is 30%, R0 = 1.2, and initial infection is 0.5%. The solid curves are results from the ODE-based system and the dotted-dashed curves are results from RealOpt agent-based simulation. (a) Results from non-interrupting supply. (b) Results from batched supply. Note the optimal mixed strategy from the batched supply (b. black curves) results in 92% increase in attack rate over the non-interrupted supply (a. purple curves).
Figure 6
Figure 6
In this figure we show daily prevalence of COVID-19, resulting from various vaccine supply levels when vaccination begins on time, or with delays of one week, two weeks, and three weeks, and is dispensed according to the associated optimal mixed strategy. Here, R0 = 1.2 and the initial infected population is 0.5%. The x-axis represents the number of days since vaccination began. The colors correspond to the vaccine levels, the line types correspond to the delay timeline.
Figure 7
Figure 7
In this figure we contrast the overall attack rate and mortality rate (Day 0 to Day 180) associated with six different vaccine supply/delay scenarios, all operating under the optimal switch triggers. The solid lines denote attack rate, and the dashed lines denote the mortality rate. R0 = 1.2, initial infection is 0.5%. Note the diminished effect of the batched supply (black).
Figure 8
Figure 8
In this figure we compare the overall attack and mortality rates under the optimal switch triggers against different dispensing throughput efficiency levels at the vaccine clinics. R0 = 1.2, initial infection is 0.5%. Solid curves denote attack rates; dotted curves denote mortality rates.
Figure 9
Figure 9
In this panel we show the optimal switch trigger (percentage of vaccine dispensed to the high-risk groups) against the vaccine supply levels in the optimal mixed strategy for different combinations of basic reproduction number and percentage of initial infectious population. Analyzing the values closely, we see that when the vaccine supply covers more than 12% of the entire population, not all individuals in the high-risk group need to be vaccinated before switching to non-prioritized strategy.
Figure 10
Figure 10
In this figure we depict the overall protection of the vaccine with respect to its efficacy across different levels of vaccine supply. The rapid decreases in attack and mortality rates across all vaccine supply levels as vaccine efficacy increases underscores the importance of rapid vaccination to contain the current outbreak and the development of booster shots to safeguard the public from new variants. Solid curves denote attack rates; dotted curves denote mortality rates.
Figure 11
Figure 11
The optimal switch trigger under different diagnostic accuracy rates.
Figure 12
Figure 12
The biological-behavior-intervention informatics computational framework. The solid line arrows represent the natural disease progression. The blue dotted line arrows represent paths individuals take on an intervention; it can be via behavior or social environmental changes; or due to available resources (e.g., diagnostic tests, hospital beds). The red dotted line arrows reflect pathways of patient conditions upon receiving intervention. The figure includes some example interventions and pathways.

Similar articles

Cited by

References

    1. Salk J.E. Considerations in the preparation and use of poliomyelitis virus vaccine. J. Am. Med. Assoc. 1955;158:239–1248. doi: 10.1001/jama.1955.02960140001001. - DOI - PubMed
    1. Hamborsky J., McIntyre L., Wolfe C., Atkinson W. Epidemiology and Prevention of Vaccine-Preventable Diseases. 10th ed. CDC, Department of Health and Human Services; Washington, DC, USA: 2007. Smallpox.
    1. Chalumeau H.P. Vaccine manufacture at the time of a pandemic influenza. Eur. J. Epidemiol. 1994;10:487–490. doi: 10.1007/BF01719684. - DOI - PubMed
    1. Ulmer J.B., Valley U., Rappuoli R. Vaccine manufacturing: Challenges and solutions. Nat. Biotech. 2006;24:1377–1383. doi: 10.1038/nbt1261. - DOI - PubMed
    1. Nathan N., Barry M., Van Herp M., Zeller H. Shortage of vaccines during a yellow fever outbreak in guinea. Lancet. 2001;358:2129–2130. doi: 10.1016/S0140-6736(01)07185-9. - DOI - PubMed