. 2021 May 14;10(5):1204.
doi: 10.3390/cells10051204.

Overexpression of Transcripts Coding for Renin-b but Not for Renin-a Reduce Oxidative Stress and Increase Cardiomyoblast Survival under Starvation Conditions

Affiliations

Overexpression of Transcripts Coding for Renin-b but Not for Renin-a Reduce Oxidative Stress and Increase Cardiomyoblast Survival under Starvation Conditions

Heike Wanka et al. Cells. .

Abstract

A stimulated renin-angiotensin system is known to promote oxidative stress, apoptosis, necrosis and fibrosis. Renin transcripts (renin-b; renin-c) encoding a cytosolic renin isoform have been discovered that may in contrast to the commonly known secretory renin (renin-a) exert protective effects Here, we analyzed the effect of renin-a and renin-b overexpression in H9c2 cardiomyoblasts on apoptosis and necrosis as well as on potential mechanisms involved in cell death processes. To mimic ischemic conditions, cells were exposed to glucose starvation, anoxia or combined oxygen-glucose deprivation (OGD) for 24 h. Under OGD, control cells exhibited markedly increased necrotic and apoptotic cell death accompanied by enhanced ROS accumulation, loss of mitochondrial membrane potential and decreased ATP levels. The effects of OGD on necrosis were exaggerated in renin-a cells, but markedly diminished in renin-b cells. However, with respect to apoptosis, the effects of OGD were almost completely abolished in renin-b cells but interestingly also moderately diminished in renin-a cells. Under glucose depletion we found opposing responses between renin-a and renin-b cells; while the rate of necrosis and apoptosis was aggravated in renin-a cells, it was attenuated in renin-b cells. Based on our results, strategies targeting the regulation of cytosolic renin-b as well as the identification of pathways involved in the protective effects of renin-b may be helpful to improve the treatment of ischemia-relevant diseases.

Keywords: ATP levels; cardiac H9c2 cells; cytosolic renin; ischemia-induced cell death; mitochondrial membrane potential; reactive oxygen species; secretory renin.


Conflict of interest statement

The authors declare no conflict of interests.

Figures

Figure 1
Figure 1
(A) Cell number and (B) percentage of trypan blue negative, viable cells of pIRES. control (n = 15), renin-b (n = 15) and renin-a cell lines (n = 11) overexpressing cytosolic and secretory renin, respectively. Cells were exposed to basal (non-treated) conditions, glucosestarvation alone, anoxia alone, and the combination of glucose starvation and anoxia (OGD) for 24 h. Renin-b overexpression was associated with a basal decrease in cell number without affecting the membrane integrity. Anoxia and OGD exposure resulted in a decrease 12 in cell number only in pIRES and renin-a cells and a reduction of membrane integrity in all three cell lines. However, for renin-b cells this effect was comparatively moderate. Data represent mean values ± SEM of 11–15 experiments. Differences were considered significant using two-way ANOVA with Bonferroni correction (p-values see text). (*): effects of the intervention (medium conditions) within the same cell line; (#): effects of renin-b or renin-a 17 overexpression, respectively, compared with pIRES control cells on same intervention.
Figure 2
Figure 2
Renin-b protects H9c2 cells from necrosis induced by ischemia-related conditions. (A) Early and (B) late necrosis of pIRES control, renin-b and renin-a cell lines overexpressing cytosolic and secretory renin, respectively. Cells were exposed to basal (non-treated) conditions, glucose starvation alone, anoxia alone and the combination of glucose starvation and anoxia (OGD) for 24 h. Early necrosis was measured by PI labeling, where early necrotic cells were PI-positive but apoptosis-negative. Late necrosis was determined by the Cytotoxicity Detection Kit as declared. Renin-b overexpression was associated with an increased percentage of early necrotic cells under basal and glucose starvation conditions. OGD exposure resulted in a strong increase of early and late necrosis in pIRES control and renin-a cells, while in renin-b cells the amount of late necrosis increased only moderately. Data represent mean values ± SEM of 5–6 experiments. Differences were considered significant using two-way ANOVA with Bonferroni correction (p-values see text). (*) effects of the intervention (medium conditions) within the same cell line; (#): effects of renin-b or renin-a overexpression, respectively, compared with pIRES control cells on same intervention; (§): effects of renin-a overexpression compared with renin-b cells on same intervention.
Figure 3
Figure 3
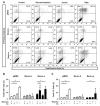
Renin-b protects H9c2 cells from activation of caspases induced by ischemia-related conditions. (A) Representative histograms of apoptotic cells exhibiting caspase activation (CaspACE marker). Propidium iodide (PI) labeling enabled differentiation between early apoptotic (PI-) and late apoptotic cells (PI+). (B) Mean percentages of total and (C) late apoptotic pIRES control, renin-b and renin-a cells are shown. Cells were exposed to basal (non-treated) conditions, glucose starvation alone, anoxia alone and the combination of glucose starvation and anoxia (OGD) for 24 h. Renin-b overexpression was associated with a protection against anoxia- and ODG-induced activation of caspases, which was observed in pIRES control and renin-a cells. Data represent mean values ± SEM of 6–7 experiments. Differences were considered significant using two-way ANOVA with Bonferroni correction (p-values see text). (*): effects of the intervention (medium conditions) within the same cell line; (#): effects of renin-b or renin-a overexpression, respectively, compared with pIRES control cells on same intervention; (§): effects of renin-a overexpression compared with renin-b cells on same intervention.
Figure 4
Figure 4
Renin-b protects H9c2 cells from intrinsically mediated apoptosis induced by ischemia-related conditions. (A) Representative histograms of apoptotic cells exhibiting Annexin V binding. Propidium iodide (PI) labeling enabled differentiation between early apoptotic (PI-) and late apoptotic cells (PI+). (B) Mean percentages of total and (C) late apoptotic pIRES control, renin-b and renin-a cells are shown. Cells were exposed to basal (non-treated) conditions, glucose starvation alone, anoxia alone, and the combination of glucose starvation and anoxia (OGD) for 24 h. Renin-b overexpression was associated with an increased number of total Annexin V-positive cells under basal conditions but also with a protection against glucose starvation- and ODG-induced apoptosis, which was observed in pIRES control and renin-a cells. Data represent mean values ± SEM of 6–7 experiments. Differences were considered significant using two-way ANOVA with Bonferroni correction (p-values see text). (*): effects of the intervention (medium conditions) within the same cell line; (#): effects of renin-b or renin-a overexpression, respectively, compared with pIRES control cells on same intervention; (§): effects of renin-a overexpression compared with renin-b cells on same intervention.
Figure 5
Figure 5
Renin-b protects H9c2 cells from Fas receptor (FasR)-mediated extrinsic pathway of apoptosis induced by ischemia-related conditions. (A) Representative histograms of apoptotic cells exhibiting FasR expression. Propidium iodide (PI) labeling enabled differentiation between early apoptotic (PI−) and late apoptotic cells (PI+). (B) Mean percentages of total and (C) late apoptotic pIRES control, renin-b and renin-a cells are shown. Cells were exposed to basal (non-treated) conditions, glucose starvation alone, anoxia alone and the combination of glucose starvation and anoxia (OGD) for 24 h. Renin-b overexpression was associated with a protection against anoxia- and ODG-induced apoptosis, which was observed in pIRES control and renin-a cells. Renin-a overexpression was accompanied by an increase in FasR expression during glucose starvation. Data represent mean values ± SEM of 6–7 experiments. Differences were considered significant using two-way ANOVA with Bonferroni correction (p-values see text). (*): effects of the intervention (medium conditions) within the same cell line; (#): effects of renin-b or renin-a overexpression, respectively, compared with pIRES control cells on same intervention; (§): effects of renin-a overexpression compared with renin-b cells on same intervention.
Figure 6
Figure 6
Renin-b protects H9c2 cells from accumulation of mitochondrial superoxides induced by OGD. (A) Representative histograms, (B) mean fluorescence intensities (FLI), and (C) mean percentages of MitoSOX-positive pIRES control, renin-b, and renin-a cells. Cells were exposed to basal (non-treated) conditions, glucose starvation alone, anoxia alone and the combination of glucose starvation and anoxia (OGD) for 24 h. Then, cells were incubated with the MitoSOX fluorophore to detect mitochondrially localized superoxides. Overexpression of renin-b and renin-a was associated with an increase in basal mitochondrial superoxides as detected by an increase in the mean FLI. Under OGD, the degradation of mitochondrial superoxides was inadequate leading to a marked increase in the percentage of MitoSOX-positive cells in pIRES control and renin-a cells. In renin-b cells, the number of MitoSOX-positive cells was also increased, but to a much smaller degree. Data represent mean values ± SEM of 9 experiments. Differences were considered significant using two-way ANOVA with Bonferroni correction (p-values see text). (*): effects of the intervention (medium conditions) within the same cell line; (#): effects of renin-b or renin-a overexpression, respectively, compared with pIRES control cells on same intervention; (§): effects of renin-a overexpression compared with renin-b cells on same intervention.
Figure 7
Figure 7
Renin-b protects H9c2 cells from accumulation of cytosolic reactive oxygen species (ROS) induced by OGD. (A) Representative histograms, (B) mean fluorescence intensities (FLI) and (C) mean percentages of dihydroethidium (DHE)-positive pIRES control, renin-b, and renin-a cells. Cells were exposed to basal (non-treated) conditions, glucose starvation alone, anoxia alone, and the combination of glucose starvation and anoxia (OGD) for 24 h. Then, cells were incubated with the DHE fluorophore to detect cytosolically localized ROS. Under OGD, the ROS content was increased as detected by an increased mean FLI in a subpopulation (DHEhigh-positive cells) of pIRES control cells. In renin-b and renin-a cells exposed to OGD the percentage of DHEhigh-positive cells was reduced compared to pIRES control cells. Data represent mean values ± SEM of 9 experiments. Differences were considered significant using two-way ANOVA with Bonferroni correction (p-values see text). (*): effects of the intervention (medium conditions) within the same cell line; (#): effects of renin-b or renin-a overexpression, respectively, compared with pIRES control cells on same intervention; (§): effects of renin-a overexpression compared with renin-b cells on same intervention.
Figure 8
Figure 8
Renin-b protects H9c2 cells from OGD-induced collapse of mitochondrial membrane potential (ΔΨm) and mitigates anoxia- and OGD-induced ATP depletion. pIRES control, renin-b and renin-a cells were exposed to basal (non-treated) conditions, glucose starvation alone, anoxia alone and the combination of glucose starvation and anoxia (OGD) for 24 h. Afterwards, (A) ΔΨm was detected by incubating cells with the JC-1 dye (n = 6–10). Analysis of the ratio of red (disturbed ΔΨm) to green (intact ΔΨm) fluorescence intensity (FLI) of JC-1-positive cells represents the ΔΨm. OGD caused a marked decrease in ΔΨm in pIRES control and renin-a cells from which renin-b cells were completely spared. (B) ATP levels (n = 9) were detected by the CellTiter-Glo® Luminescent Cell Viability Assay (n = 9). ATP levels were decreased in all cell lines during anoxia and OGD but mitigated in renin-b and renin-a cells. Data represent mean values ± SEM of indicated experiments. Differences were considered significant using two-way ANOVA with Bonferroni correction (p-values see text). (*): effects of the intervention (medium conditions) within the same cell line; (#): effects of renin-b or renin-a overexpression, respectively, compared with pIRES control cells on same intervention; (§): effects of renin-a overexpression compared with renin-b cells on same intervention.

Similar articles

Cited by

References

    1. Clausmeyer S., Sturzebecher R., Peters J. An alternative transcript of the rat renin gene can result in a truncated prorenin that is transported into adrenal mitochondria. Circ. Res. 1999;84:337–344. doi: 10.1161/01.RES.84.3.337. - DOI - PubMed
    1. Lee-Kirsch M.A., Gaudet F., Cardoso M.C., Lindpaintner K. Distinct renin isoforms generated by tissue-specific transcription initiation and alternative splicing. Circ. Res. 1999;84:240–246. doi: 10.1161/01.RES.84.2.240. - DOI - PubMed
    1. Sinn P.L., Sigmund C.D. Identification of three human renin mRNA isoforms from alternative tissue-specific transcriptional initiation. Physiol. Genom. 2000;3:25–31. doi: 10.1152/physiolgenomics.2000.3.1.25. - DOI - PubMed
    1. Lutze P., Wanka H., Bäumgen I., Staar D., Grunow B., Peters J. An alternative promoter in intron1 of the renin gene is regulated by glucose starvation via serum response factor. Cell. Physiol. Biochem. 2017;42:1447–1457. doi: 10.1159/000479209. - DOI - PubMed
    1. Clausmeyer S., Reinecke A., Farrenkopf R., Unger T., Peters J. Tissue-specific expression of a rat renin transcript lacking the coding sequence for the prefragment and its stimulation by myocardial infarction. Endocrinology. 2000;141:2963–2970. doi: 10.1210/endo.141.8.7623. - DOI - PubMed

LinkOut - more resources