Review
. 2021 May 14;22(10):5216.
doi: 10.3390/ijms22105216.

Diffusion Magnetic Resonance Imaging-Based Biomarkers for Neurodegenerative Diseases

Affiliations
Review

Diffusion Magnetic Resonance Imaging-Based Biomarkers for Neurodegenerative Diseases

Koji Kamagata et al. Int J Mol Sci. .

Abstract

There has been an increasing prevalence of neurodegenerative diseases with the rapid increase in aging societies worldwide. Biomarkers that can be used to detect pathological changes before the development of severe neuronal loss and consequently facilitate early intervention with disease-modifying therapeutic modalities are therefore urgently needed. Diffusion magnetic resonance imaging (MRI) is a promising tool that can be used to infer microstructural characteristics of the brain, such as microstructural integrity and complexity, as well as axonal density, order, and myelination, through the utilization of water molecules that are diffused within the tissue, with displacement at the micron scale. Diffusion tensor imaging is the most commonly used diffusion MRI technique to assess the pathophysiology of neurodegenerative diseases. However, diffusion tensor imaging has several limitations, and new technologies, including neurite orientation dispersion and density imaging, diffusion kurtosis imaging, and free-water imaging, have been recently developed as approaches to overcome these constraints. This review provides an overview of these technologies and their potential as biomarkers for the early diagnosis and disease progression of major neurodegenerative diseases.

Keywords: Alzheimer’s disease; Parkinson’s disease; amyotrophic lateral sclerosis; biomarker; diffusion kurtosis imaging; diffusion tensor imaging; free-water imaging; neurite orientation dispersion and density imaging.


Conflict of interest statement

The authors declare no conflict of interest.

Figures

Figure 1
Figure 1
Tract-based spatial statistics. Axial and midsagittal views show significant differences in FA (row 1), RD (row 2), RK (row 3), and AWF (row 4) between patients with low Aβ (Aβ)/intermediate Aβ (Aβi) and Aβi/high Aβ (Aβ+) levels. Clusters of increases (red/orange) and decreases (blue/purple) in Aβ levels are overlaid on the FA template, together with the mean skeleton (green). The observed differences between the Aβ and Aβi groups are in the opposite direction to those observed between the Aβi and Aβ+ groups. Tract-based spatial statistics reveals significant differences involving the genu of the corpus callosum and the anterior corona radiata. Directions of changes are consistent with those observed in region-of-interest analysis. Abbreviations: Aβ, amyloid-β; AWF, axonal water fraction; FA, fractional anisotropy; RD, radial diffusivity; RK, radial kurtosis (adapted and reproduced with permission by Dong et al. [64]).
Figure 2
Figure 2
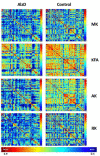
Interregional correlation matrix (90 × 90) for the DKI metrics of MK, KFA, AK, and RK in patients with AlzD and controls. Color bar represents the scale of correlations for interregional parameters. Red color represents higher positive correlation values and blue color represents higher negative correlation values. The maps reveal a great degree of dispersion in DKI observed in patients with AlzD. Note that stronger positive coordinated effects are present in extensive brain regions, indicated by red color for the metrics of MK, KFA, AK, and RK, in the control group compared with the AlzD group, and KFA is typical. A higher KFA value indicates a more compact histological structure. Abbreviations: AK, axial kurtosis; AlzD, Alzheimer’s disease; DKI, diffusion kurtosis imaging; KFA, kurtosis fractional anisotropy; MK, mean kurtosis; RK, radial kurtosis (adapted and reproduced with permission from Cheng et al. [69]).
Figure 3
Figure 3
Baseline tract associations with composite memory and executive function (A,B). The medial temporal lobe tract measures exhibiting associations with memory (A) and executive function (B) include FW in the cingulum bundle, tapetum, UF, and ILF. The association of ILF FW with memory performance (A) and the association of tapetum FW with executive function performance (B) are shown. Baseline tract hippocampal interaction on annual change in memory and executive function (C,D). The medial temporal lobe tract measures exhibiting significant interaction with hippocampal volume for annual change in memory include FAT in the ILF and cingulum bundle (C). For annual change in executive function performance, temporal tract measures exhibiting significant interaction with hippocampal volume include FAT in the fornix (D). Groups with and without hippocampal neurodegeneration groups (positive and negative groups, respectively) are based on the previously identified cut-off volume (positive: volume ≤6723 mm3 [81]). Abbreviations: eMCI, early mild cognitive impairment; FAT, free water-corrected FA; FW, free water; ILF, inferior longitudinal fasciculus; MCI, mild cognitive impairment; UF, uncinate fasciculus (adapted and reproduced with permission from Archer et al. [79]).
Figure 4
Figure 4
Cortical thickness patterns in the AlzD continuum. Differences in cortical thickness between stage 0 and stage 1 control subjects (A), stage 0 and stage 2 control subjects (B), stage 0 control subjects and patients with MCI-AD (C), and stage 0 control subjects and patients with dAD (D). Only clusters that survived familywise error correction (p < 0.05) are shown. All analyses are adjusted for age, sex, center, and APOE ε4 status. Cortical MD patterns in the AlzD continuum. Differences in MD between stage 0 and stage 1 control subjects (E), stage 0 and stage 2 control subjects (F), stage 0 control subjects and patients with MCI-AD (G), and stage 0 control subjects and patients with dAD (H). Only clusters that sur-vived familywise error correction (p < 0.05) are shown. All analyses are adjusted for age, sex, and APOE ε4 status. FW patterns in the AlzD continuum. Differences in FW between stage 0 and stage 1 control subjects (I), stage 0 and stage 2 control subjects (J), stage 0 and MCI-AD patients (K), and stage 0 control subjects and patients with dAD (L). Only clusters that survived familywise error correction (p < 0.05) are shown. All analyses are adjusted for age, sex, and APOE ε4 status. For visualization, different color codes are used for the MD, FW, and cortical thickness patterns. For MD and FW, a green-yellow color code is used; purple and white colors represent positive and negative significant values, respectively. For cortical thickness, a blue gradient scale is used as a color code; red and yellow colors represent negative and positive significant values, respectively. In the comparison between stage 2 and 0 control subjects, significant clusters are high-lighted with an asterisk to facilitate visualization. Abbreviations: AD, Alzheimer’s disease; APOE, apolipoprotein E; dAD, Alzheimer’s disease dementia with evidence of an underlying Alzheimer’s disease-related pathophysiological process; FW, free-water volume fraction; MCI-AD, mild cognitive impairment with evidence of an underlying Alzheimer’s dis-ease-related pathophysiological process; MD, mean diffusivity (adapted and reproduced with permission from Montal et al. [82]).
Figure 5
Figure 5
Voxel-wise correlations between PET and NODDI. Note the negative correlation between 18F-THK5351 accumulation and NDI in the AD-S group (A), the negative correlation between 18F-THK5351 accumulation and ODI in the AD-S group (B), and the negative correlation between 11C-PiB accumulation and ODI in the AD-S group (C). Color bars denote statistically significant T-values ranging from minimum to maximum. Abbreviations: AD-S, Alzheimer’s disease spectrum; NDI, neurite density index; NODDI, neurite orientation dispersion and density imaging; ODI, orientation dispersion index; PET, positron emission tomography (adapted and reproduced with permission from Sone et al. [83]).
Figure 6
Figure 6
Summary of identified patterns (A) and statistics (B) for all diffusion metrics. (A) Among the DTI-derived metrics, higher tau-PET signals are consistently associated with decreased FA and increased MD, AD, and RD. Among the NODDI-derived metrics, higher tau-PET signals are associated with decreased ICVF, a proxy for axonal density. Increased ODI is detected in only two pathways. Independent data-driven iterative searching on AD and ICVF reveals patters similar to that observed with MD. (B) Statistics of the association patterns. “# pathways” denotes the total number of detected pathways that contain a dual association between tau on both ends and a diffusion metric in the connection (i.e., color-coded connections in (A). Adjusted r2diff describes the additional variance in tau-PET signal explained by a diffusion metric in a multivariate regression model that controls for age and sex in the detected pathways. Only significant r2diff values with a p-value of <0.05 are listed. “Direction of change” denotes the direction of change in the diffusion metric in the setting of increased tau-PET signal in adjacent regions of interest in the gray matter. Abbreviations; AD, axial diffusivity; DTI, diffusion tensor imaging; FA, fractional anisotropy; ICVF, intracellular volume fraction; iter, iteration; MD, mean diffusivity; NODDI, neurite orientation dispersion and density imaging; ODI, orientation dispersion index; PET, positron emission tomography; RD, radial diffusivity (adapted and reproduced with permission from Wen et al. [86]).
Figure 7
Figure 7
Left panel: Volumes of interest in bilateral red nuclei and the substantia nigra (A). Data were obtained from maps of mean diffusivity (B), fractional anisotropy (C), and mean kurtosis (D). Right panel: Diffusion kurtosis imaging values in the substantia nigra for CTL, ESPD, and ASPD groups. ** p < 0.01, ASPD vs. CTL; * p < 0.05, ESPD vs. CTL, ASPD vs. CTL, and ASPD vs. ESPD. Abbreviations: ASPD, advanced-stage Parkinson’s disease; CTL, control; ESPD, early-stage Parkinson’s disease; FALSN, fractional anisotropy of left substantia nigra; FARSN, fractional anisotropy of right substantia nigra; MDLSN, mean diffusivity of left substantia nigra; MDRSN, mean diffusivity of right substantia nigra; MKLSN, mean kurtosis of left substantia nigra; MKRSN, mean kurtosis of right substantia nigra (adapted and reproduced with permission from Guan et al. [102]).
Figure 8
Figure 8
Task-based fMRI signal in the posterior putamen contralateral to the tested hand and free water volume fraction in the posterior substantia nigra averaged across sides, plotted for one control subject, one patient with PD treated with rasagiline, and one patient with PD not treated with rasagiline. Abbreviations: BOLD, blood oxygen-level dependent; C, contralateral; dMRI, diffusion magnetic resonance imaging; fMRI, functional magnetic resonance imaging; I, ipsilateral; PD, Parkinson’s disease (adapted and reproduced with permission from Burciu et al. [119]).
Figure 9
Figure 9
NODDI imaging in Parkinsonism. Between-group differences in patients with PD, MSAp, and PSP compared to controls in all regions of interest for each NODDI metric. * p < 0.05, false discovery rate-corrected. Abbreviations: aSN, anterior substantia nigra; CC1, prefrontal corpus callosum; CC2, premotor corpus callosum; CN, caudate nucleus; DN, dentate nucleus; GP, globus pallidus; LB V, cerebellar lobule V; LB VI, cerebellar lobule VI; MCP, middle cerebellar peduncle; ODI, orientation dispersion index; PPN, pedunculopontine nucleus; pSN, posterior substantia nigra; PUT, putamen; RN, red nucleus; SCP, superior cerebellar peduncle; STN, subthalamic nucleus; THA, thalamus; VER, cerebellar vermis; Vic, intracellular volume fraction; Viso, isotropic volume fraction (adapted and reproduced with permission from Mitchell et al. [120]).
Figure 10
Figure 10
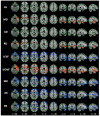
Areas with significant differences between patients with PD and controls based on GBSS analysis of the DTI, DKI, and NODDI metrics. GBSS analysis shows decreased FA, ICVF, MK, AK, and RK (blue-light blue voxels) and increased MD, AD, RD, and ISOVF (red-yellow voxels) in patients with PD compared with age-matched controls. All images are displayed according to neurological conventions on the Montreal Neurological Institute template. In patients with PD, the cortical GM in the limbic, paralimbic, frontal, and temporal areas demonstrated significantly decreased RK, MK, AK, and ICVF in comparison with the control group (GBSS analysis). Areas with significant changes in conventional DTI parameters (FA, AD, and RD) are visibly smaller than those with significant changes in RK, MK, AK, and ICVF. Results with significance (corrected p < 0.05) were thickened using the fill script implemented in FSL to improve visualization. Abbreviations: AD, axial diffusivity; AK, axial kurtosis; FA, fractional anisotropy; GBSS, gray matter-based spatial statistics; GM, gray matter; ICVF, intracellular volume fraction; ISOVF, isotropic volume fraction; MD, mean diffusivity; MK, mean kurtosis; OD, orientation dispersion index; PD, Parkinson’s disease; RD, radial diffusivity; RK, radial kurtosis (adapted and reproduced with permission from Kamagata et al. [28]).
Figure 11
Figure 11
Significant tracts revealed by tract-of-interest analysis for comparison of diagnostic groups. Mean of each measure in the PD-woNCPs and PD-wNCPs groups, represented as percentage difference from healthy controls (A). Non-significant tracts are shown in gray, whereas significant tracts (* p < 0.05, ** p < 0.01, *** p < 0.001) are displayed in other colors. Tracts with significant differences between the PD-woNCPs and PD-wNCPs groups. Tracts obtained using the ICBM-DTI-81 white matter tractography atlas (B). Abbreviations: ATR, anterior thalamic radiation; FA, fractional anisotropy; HC, healthy control; ICVF, intracellular volume fraction; IFOF, inferior fronto-occipital fasciculus; ILF, inferior longitudinal fasciculus; MD, mean diffusivity; PD-woNCPs, Parkinson’s disease without neurocognitive and psychiatric symptoms; PD-wNCPs, Parkinson’s disease with neurocognitive and psychiatric symptoms; RD, radial diffusivity; SLF, superior longitudinal fasciculus; UF, uncinate fasciculus (adapted and reproduced with permission from Andica et al. [127]).
Figure 12
Figure 12
Top 30 neural connections determined by Grad-CAM analysis for differentiating patients with PD from healthy controls with ICVF-weighted (A) and AVF-weighted (B) connectome matrices. The more intensely focused connections are represented in a more reddish color. Abbreviations: AVF, axonal volume fraction; Grad-CAM, gradient-weighted class activation mapping; ICVF, intracellular volume fraction; PD, Parkinson’s disease (adapted and reproduced with permission from Yasaka et al. [128]).
Figure 13
Figure 13
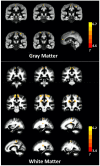
GM and WM regions with significantly decreased MK in ALS patients. The images displayed are overlaid on the averaged GM and WM maps derived from all subjects. Color bar represents T-values to indicate the difference in MK between patients with ALS and controls. Abbreviations: ALS, amyotrophic lateral sclerosis; GM, gray matter; MK, mean kurtosis; WM, white matter (adapted and reproduced with permission from Huang et al. [134]).
Figure 14
Figure 14
Areas showing significant differences in the whole-brain NODDI parameters of NDI (A), ODI (B), and ISO (C) between ALS and control groups. The results are shown using a statistical significance of p < 0.05 after family-wise error correction at the cluster level, with the clusters created using a p-value of <0.001. Panels Aiviii show the areas with significant differences in NDI on axial sections from the posterior limb of the internal capsule (vi) extending rostrally up into the subcortical WM of the precentral gyrus (viii). Abbreviations: ALS, amyotrophic lateral sclerosis; ISO, isotropic component; NDI, neurite density index; NODDI, neurite orientation dispersion density imaging; ODI, orientation dispersion index; WM, white matter (adapted and reproduced with permission from Broad et al. [137]).
Figure 15
Figure 15
White matter alterations in C9ORF72 mutation carriers. Color-coded representation of p-values corresponding to the association of C9ORF72 mutation with white matter integrity after correction for multiple comparisons. MD (A), AD (B), RD (C), and NDI (D). Abbreviations: AD, axial diffusivity; MD, mean diffusivity; NDI, neurite density index; RD, radial diffusivity (adapted and reproduced with permission from Wen et al. [138]).

Similar articles

Cited by

References

    1. Prince M., Bryce R., Albanese E., Wimo A., Ribeiro W., Ferri C.P. The global prevalence of dementia: A systematic review and metaanalysis. Alzheimer’s Dement. J. Alzheimer’s Assoc. 2013;9:63–75.e62. doi: 10.1016/j.jalz.2012.11.007. - DOI - PubMed
    1. GBD 2016 Parkinson’s Disease Collaborators Global, regional, and national burden of Parkinson’s disease, 1990-2016: A systematic analysis for the Global Burden of Disease Study 2016. Lancet. Neurol. 2018;17:939–953. doi: 10.1016/S1474-4422(18)30295-3. - DOI - PMC - PubMed
    1. Assaf Y., Pasternak O. Diffusion tensor imaging (DTI)-based white matter mapping in brain research: A review. J. Mol. Neurosci. 2008;34:51–61. doi: 10.1007/s12031-007-0029-0. - DOI - PubMed
    1. Mori S., Zhang J. Principles of diffusion tensor imaging and its applications to basic neuroscience research. Neuron. 2006;51:527–539. doi: 10.1016/j.neuron.2006.08.012. - DOI - PubMed
    1. Alexander A.L., Lee J.E., Lazar M., Field A.S. Diffusion tensor imaging of the brain. Neurotherapeutics. 2007;4:316–329. doi: 10.1016/j.nurt.2007.05.011. - DOI - PMC - PubMed

MeSH terms