. 2021 May 14;13(10):2383.
doi: 10.3390/cancers13102383.

Reduced Lamin A/C Does Not Facilitate Cancer Cell Transendothelial Migration but Compromises Lung Metastasis

Affiliations

Reduced Lamin A/C Does Not Facilitate Cancer Cell Transendothelial Migration but Compromises Lung Metastasis

Francesco Roncato et al. Cancers (Basel). .

Abstract

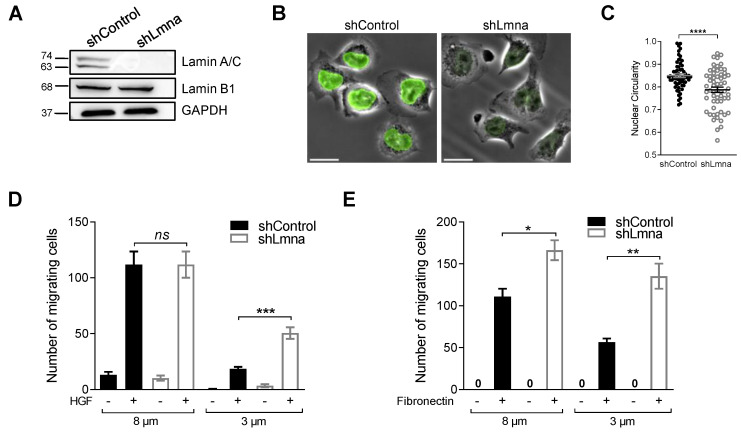
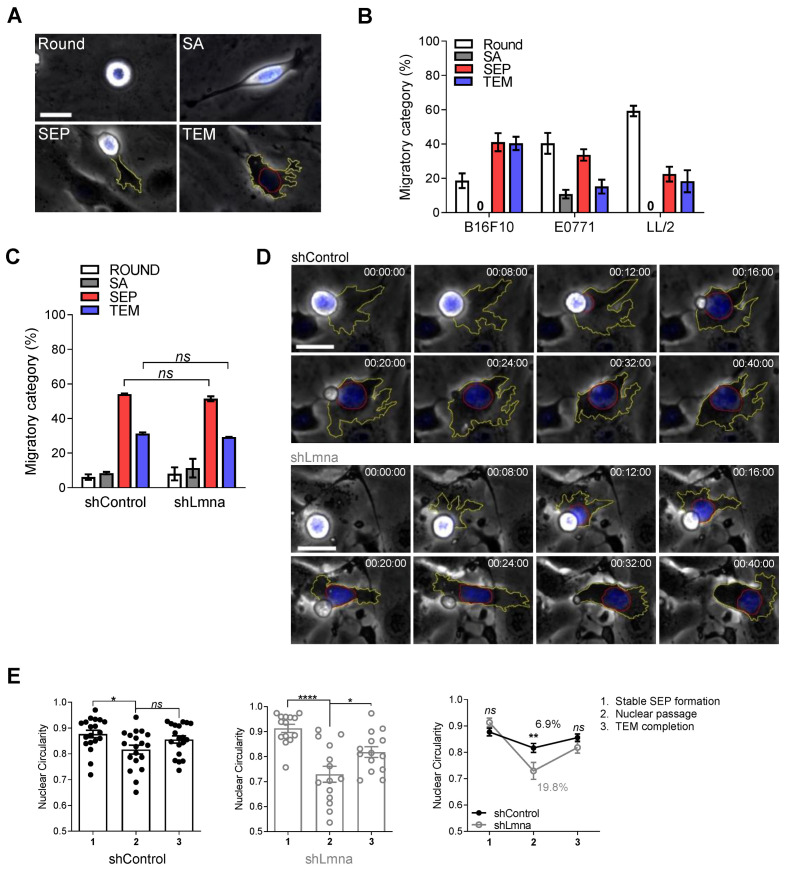
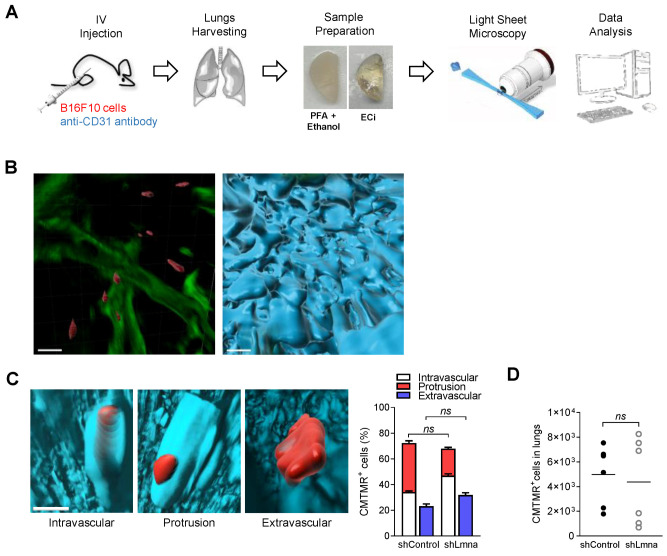
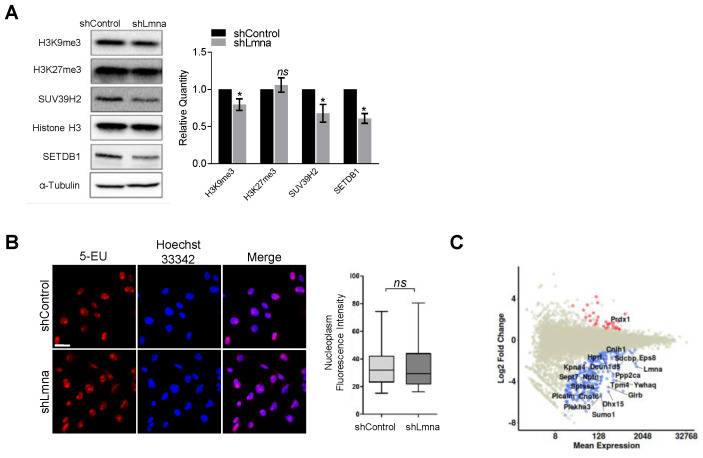
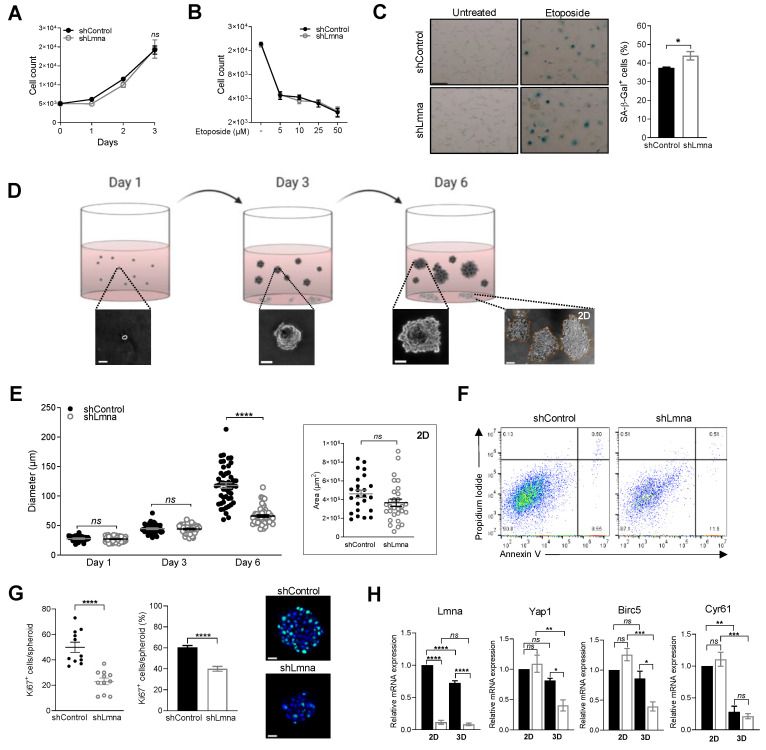
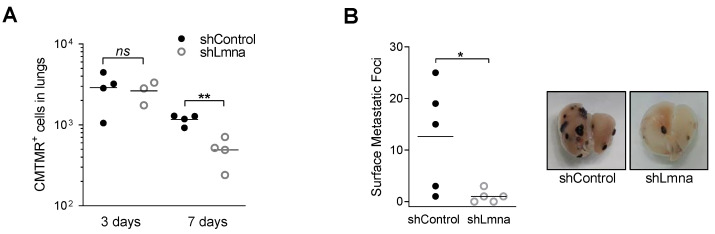
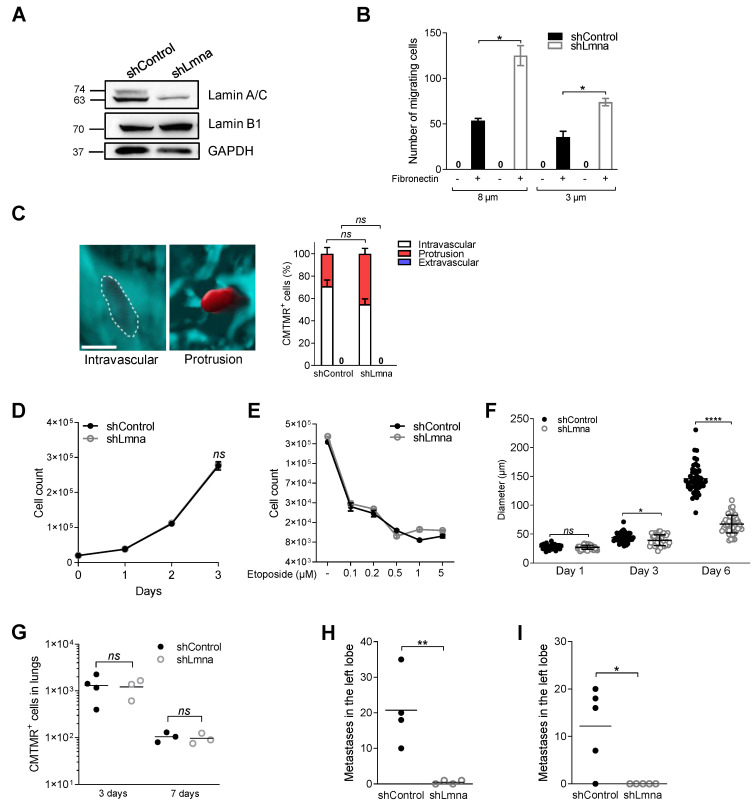
The mechanisms by which the nuclear lamina of tumor cells influences tumor growth and migration are highly disputed. Lamin A and its variant lamin C are key lamina proteins that control nucleus stiffness and chromatin conformation. Downregulation of lamin A/C in two prototypic metastatic lines, B16F10 melanoma and E0771 breast carcinoma, facilitated cell squeezing through rigid pores, and reduced heterochromatin content. Surprisingly, both lamin A/C knockdown cells grew poorly in 3D spheroids within soft agar, and lamin A/C deficient cells derived from spheroids transcribed lower levels of the growth regulator Yap1. Unexpectedly, the transendothelial migration of both cancer cells in vitro and in vivo, through lung capillaries, was not elevated by lamin A/C knockdown and their metastasis in lungs was even dramatically reduced. Our results are the first indication that reduced lamin A/C content in distinct types of highly metastatic cancer cells does not elevate their transendothelial migration (TEM) capacity and diapedesis through lung vessels but can compromise lung metastasis at a post extravasation level.

Keywords: cancer metastasis; chemotaxis; diapedesis; epigenetics; extravasation; imaging; nucleus.


Conflict of interest statement

The authors declare no conflict of interest.

Figures

Figure 1
Figure 1
Downregulation of lamin A/C increases melanoma squeezing through small rigid pores but does not facilitate tumor transendothelial migration in vitro. (A) Expression levels of lamin A/C and lamin B1 in B16F10 cells transduced with control or lamin A/C shRNA. Glyceraldehyde-3-phosphate dehydrogenase (GAPDH) was used as loading control. (B) Representative immunostaining of lamin A/C (green), superimposed on phase contrast images of B16F10 shControl and shLmna cells. Scale bar, 20 µm. (C) Nuclear circularity of B16F10 shControl or shLmna cells spread on a bEnd.3-derived basement membrane (n = 50). See also Video S4. Data are represented as mean ± SEM. **** p < 0.0001, Student’s two-tailed unpaired t test (AC). (D) Chemotactic migration of B16F10 shControl or shLmna cells through 8 or 3 µm pores transwell filters in presence (+) or absence (−) of HGF (50 ng/mL) for 4 h. Data are represented as mean ± SEM of three independent experiments. *** p (0.0002); ns: nonsignificant. (E) Haptotactic migration of B16F10 shControl or shLmna cells through 8 or 3 µm pores transwell filters in the presence or absence of fibronectin for 4 h. Data are represented as mean ± SEM of three independent experiments. * p (0.0107); ** p (0.0024). Student’s two-tailed unpaired t test (C,D).
Figure 2
Figure 2
Downregulation of lamin A/C does not facilitate melanoma TEM but increases tumor nucleus deformability. (A) Representative images of distinct tumor cell categories (referred to as migratory categories) taken from time-lapse video microscopy segments of individual B16 cells: round, spread above (SA), forming subendothelial pseudopodia (SEP), and completing transendothelial migration (TEM). The contours of the tumor cell’s leading edge and nucleus are outlined in yellow and red respectively. Scale bar, 20 µm. See also Video S2. (B) Migratory categories of B16F10 melanoma, E0771 breast carcinoma and LL/2 Lewis Lung Carcinoma cells interacting with bEnd.3 monolayers (n = 60). Data are represented as mean ± SEM of two independent experiments. (C) Migratory categories of B16F10 shControl or shLmna cells interacting with unstimulated bEnd.3 cells (n = 60). Data are represented as mean ± SEM of three independent experiments. (D) Serial images of representative B16F10 control and lamin A/C knockdown cells, labeled with Hoechst 33342, during TEM. Scale bar, 20 µm. Time intervals are depicted in each image. The contours of the tumor cell’s leading edge and nucleus are outlined in yellow and red respectively. See also Video S3. (E) Changes of nuclear circularity during the distinct phases (1–3) of transendothelial migration of B16F10 shControl or shLmna cells (n = 19, shControl; n= 14, shLmna). Data are represented as mean ± SEM. * p (shControl) = 0.0190; * p (shLmna) = 0.0338; **** p < 0.0001. The right inset depicts the mean nuclear circularity ± SEM for each experimental group. The percent changes in mean circularity values are shown. ** p (0.0057); ns: nonsignificant. Two-way (A,C inset) or one-way (C) ANOVA with Bonferroni’s (A,C inset) or Tukey’s (C) post hoc tests.
Figure 3
Figure 3
In vivo melanoma crossing of lung capillaries is not enhanced by lamin A/C downregulation. (A) Schematic representation of the LSFM analysis. (B) Visualization of 3D bronchial structures (green, autofluorescence) together with B16F10 cells (red, CMTMR) and alveolar capillaries (cyan, CD31). Scale bars, 100 μm. See also Video S5. (C) Representative 3D images of intravascular, extravascular, and protrusive tumor cells across the CD31-labeled lung vasculature together with the percentage of B16F10 shControl and shLmna cells present in a volume of 5 × 109 µm3 of the left lung lobe 3 h after retro-orbital injection. Cells were counted using Imaris software (n = 40 cells). A representative of two experiments. Scale bar, 100 µm. See also Videos S6–S8. (D) The number of CMTMR-labeled B16F10 shControl or shLmna cells present in the entire lungs of recipient mice, 3 h after retro-orbital injection, quantified by flow cytometry (n = 6 mice). ns: nonsignificant. Two-way ANOVA with Bonferroni’s post hoc test (C), Student’s two-tailed unpaired t test (D).
Figure 4
Figure 4
Lamin A/C downregulation reduces heterochromatin content but represses gene transcription. (A) Equal amounts of proteins from B16F10 shControl or shLmna cells, separated by SDS-PAGE and analyzed for the indicated proteins by Western blot analysis. The bar graph represents the mean levels of H3K9me3, H3K27me3 and SUV39H2 normalized to Histone H3 and of SETDB1 normalized to α-Tubulin ±SEM of at least four independent experiments. * p < 0.05; ns: nonsignificant. (B) Fluorescence microscopy imaging of 5-ethynyl uridine (EU) incorporation (red) and Hoechst 33342 (blue) in B16F10shControl and shLmna cells (n = 90). Data are represented as mean ± SEM of three independent experiments. Scale bar, 25 µm. (C) Log2FoldChange versus mean expression levels of differentially downregulated (blue), upregulated (red) and nondifferentially expressed genes (grey) are shown. The names of the top 20 most significantly expressed genes are indicated in the plot. Student’s two-tailed unpaired t test (B), Mann–Whitney two-tailed U test (C).
Figure 5
Figure 5
Melanoma proliferation in spheroids is reduced by lamin A/C downregulation. (A) In vitro cell growth of B16F10 shControl or shLmna cells. Data are represented as mean ± SEM of three independent experiments. (B) Growth arrest of B16F10 shControl or shLmna cells treated for 72 h with different concentrations of etoposide. Data are represented as mean ± SEM of two independent experiments. (C) Senescence associated β-galactosidase staining of B16F10 shControl or shLmna cells treated with 5 µM etoposide for 72 h, washed and cultured in regular growth medium for additional 120 h (n = 60). * p (0.0470). Scale bar, 20 µm. Data are represented as mean ± SEM of two independent experiments. (D) Schematic representation of the soft agar colony formation assay. Spheroids (dark grey) grow inside agarose while few cells migrate and start dividing at the bottom of the culture dish. Created with BioRender.com. Representative images of the spheroids derived from B16F10 shControl cells grown in 3D agar (supplemented with 10% FBS) imaged on days 1, 3 and 6. Scale bar, 20 µm. A representative image of three cell colonies proliferating on the bottom of the dish is depicted on the right. Scale bar, 200 µm. (E) Spheroid diameter, measured on days 1, 3 and 6 after seeding (n = 50). Data are represented as mean ± SEM of two independent experiments. Inset depicts the mean area ± SEM of individual 2D cell colonies proliferating on the bottom of the dish, measured on day 6 post seeding. The numbers of detectable spheroids for the two experimental groups compared were not significantly different (not shown). (F) Flow cytometry plots showing annexin V (X-axis) and propidium iodide (Y-axis) staining of B16F10 shControl or shLmna cells derived from 3D colonies grown in soft agar on day 6. The left lower quadrant indicates viable cells. (G) The left and middle panels depict, respectively, the numbers of Ki67+ B16F10 shControl or shLmna cells in individual spheroids isolated on day 6 and their fractions within each spheroid (n = 11). Representative immunostaining of spheroids for Ki67 (green), superimposed on Hoechst 33342 labeled nuclear staining (blue) is shown in the right panels. Scale bar, 20 µm. (H) Relative Lmna, Yap1, Birc5 and Cyr61 transcription levels assessed by qRT-PCR for control and lamin A/C knockdown B16 cells grown on 2D plates or within 3D spheroids isolated on day 6 post seeding. Values are relative to shControl grown in 2D. Data are represented as mean ± SEM of three independent experiments. * p < 0.05; ** p < 0.005; *** p < 0.0005; **** p < 0.0001; ns: nonsignificant. Student’s two-tailed unpaired t test (AC,E,G) or one-way ANOVA with Tukey’s post hoc test (H).
Figure 6
Figure 6
Lamin A/C downregulation does not affect early melanoma accumulation but abrogates metastatic growth in the lungs. (A) Number of CMTMR-labeled B16F10shControl and shLmna cells present in the lungs of recipient mice on days 3 and 7 after tail vein injection (n = 4; n = 3, shLmna on day 3). ** p (0.0019); ns: nonsignificant. (B) 40,000 B16F10 shControl and shLmna cells were injected into the tail vein of recipient C57BL/6 mice. After 14 days, animals were euthanized, lungs harvested and surface metastatic foci were macroscopically counted (n = 5). * p (0.0374). Representative lung images from each group are displayed. Student’s two-tailed unpaired t test (A,B).
Figure 7
Figure 7
Lamin A/C downregulation in E0771 increases their squeezing capacity in vitro but reduces growth in 3D spheroids and metastatic potential in the lungs. (A) Expression levels of lamin A/C and lamin B1 in E0771 cells transduced with control or lamin A/C shRNA. Glyceraldehyde-3-phosphate dehydrogenase (GAPDH) was used as loading control. (B) Haptotactic migration of E0771 shControl and shLmna cells through 8 or 3 µm pores transwell filters in the presence (+) or absence (−) of fibronectin for 4 h. Data are presented as mean ± SEM of three independent experiments. * p (8 µm) = 0.0240; * p (3 µm) = 0.0371. (C) Representative 3D images of an intravascular (marked by a white contour) or a protrusive tumor cell crossing the CD31-labeled lung vasculature, along with the percentage of E0771 shControl and shLmna cells present in a volume of 5 × 109 µm3 of the left lung lobe (3 h after retro-orbital injection) counted using Imaris software (n = 40 cells). Data are represented as mean ± SEM of two independent experiments. Scale bar, 100 µm. (D) In vitro cell growth of E0771 shControl or shLmna cells cultured replacing growth medium every 24 h. Data are represented as mean ± SEM of three independent experiments. (E) Growth arrest induced by etoposide at different concentrations on E0771shControl and shLmna cells after treatment for 72 h. Data are represented as mean ± SEM of three independent experiments. (F) Spheroid diameter measured on days 1, 3 and 6 after seeding (n = 50). Data are represented as mean ± SEM of two independent experiments. * p (0.0152); **** p < 0.0001; ns: nonsignificant. (G) Number of CMTMR-labeled E0771 shControl and shLmna cells present in the lungs of recipient mice 3 days after retro-orbital injection and 7 days after tail vein injection (n = 3; n = 4, shControl on day 3). (H,I) Experimental lung metastasis of E0771 breast cancer cells. 20,000 (H) or 10,000 (I) E0771 shControl and shLmna cells were injected into the tail vein of recipient C57BL/6 mice. After 14 days (H) or 30 days (H), animals were euthanized and lungs harvested. The number of micrometastases present in an H&E-stained section of the left lung lobe was determined using CaseViewer software (n = 4; n = 5). ** p (0.0030); * p (0.0246); ns: nonsignificant. Student’s two-tailed unpaired t test (B,DI), two-way ANOVA with Bonferroni’s post hoc test (C).

Similar articles

Cited by

References

    1. Friedl P., Wolf K., Lammerding J. Nuclear Mechanics during Cell Migration. Curr. Opin. Cell Biol. 2011;23:55–64. doi: 10.1016/j.ceb.2010.10.015. - DOI - PMC - PubMed
    1. Burke B., Stewart C.L. The Nuclear Lamins: Flexibility in Function. Nat. Rev. Mol. Cell Biol. 2013;14:13–24. doi: 10.1038/nrm3488. - DOI - PubMed
    1. Lammerding J., Fong L.G., Ji J.Y., Reue K., Stewart C.L., Young S.G., Lee R.T. Lamins a and C but Not Lamin B1 Regulate Nuclear Mechanics. J. Biol. Chem. 2006;281:25768–25780. doi: 10.1074/jbc.M513511200. - DOI - PubMed
    1. Shin J.W., Spinler K.R., Swift J., Chasis J.A., Mohandas N., Discher D.E. Lamins Regulate Cell Trafficking and Lineage Maturation of Adult Human Hematopoietic Cells. Proc. Natl. Acad. Sci. USA. 2013;110:18892–18897. doi: 10.1073/pnas.1304996110. - DOI - PMC - PubMed
    1. Towbin B.D., Meister P., Gasser S.M. The Nuclear Envelope—A Scaffold for Silencing? Curr. Opin. Genet. Dev. 2009;19:180–186. doi: 10.1016/j.gde.2009.01.006. - DOI - PubMed