. 2021 May 19;10(5):1250.
doi: 10.3390/cells10051250.

Modulation of Cyclic AMP Levels in Fallopian Tube Cells by Natural and Environmental Estrogens

Affiliations

Modulation of Cyclic AMP Levels in Fallopian Tube Cells by Natural and Environmental Estrogens

Marinella Rosselli et al. Cells. .

Abstract

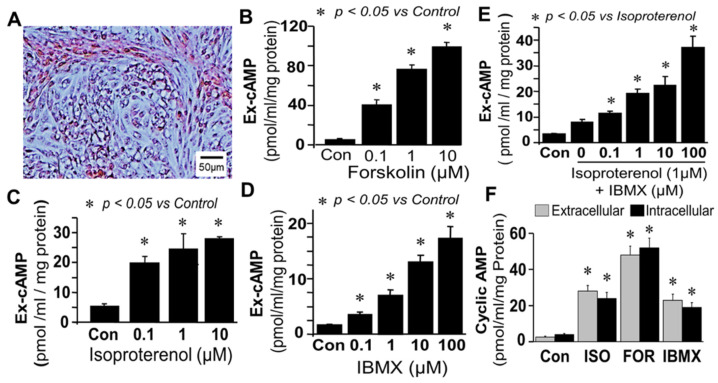
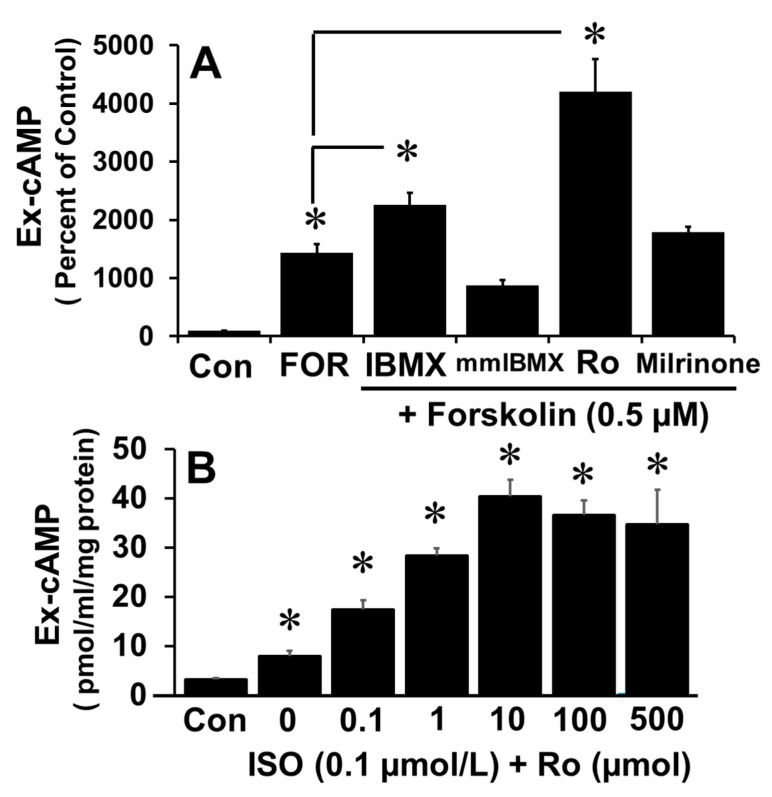
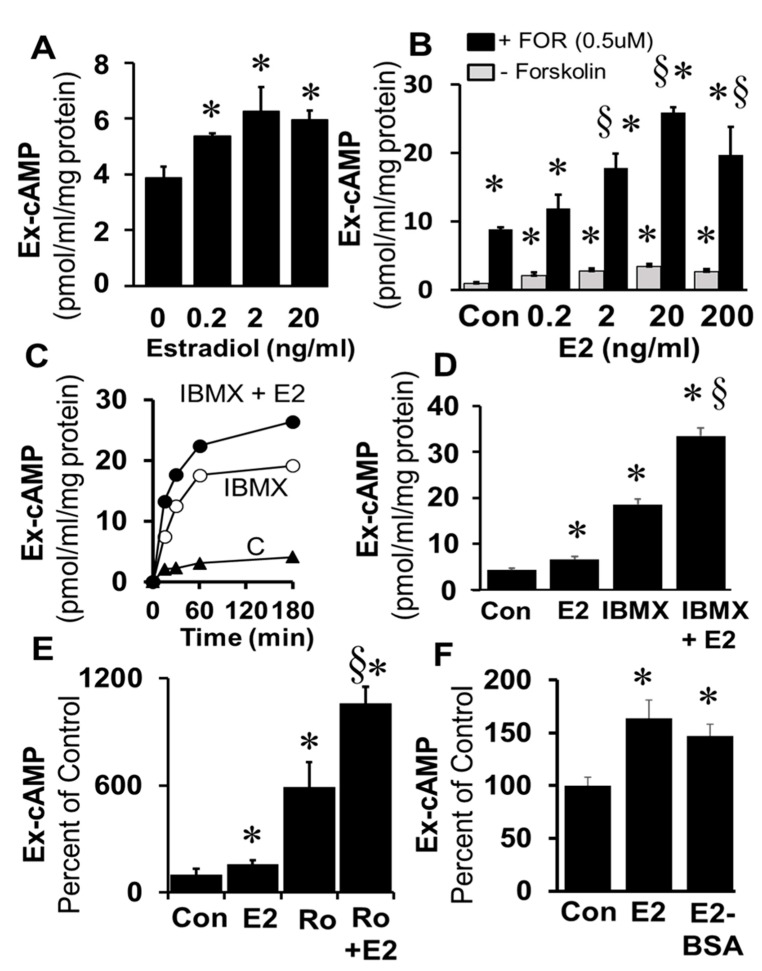
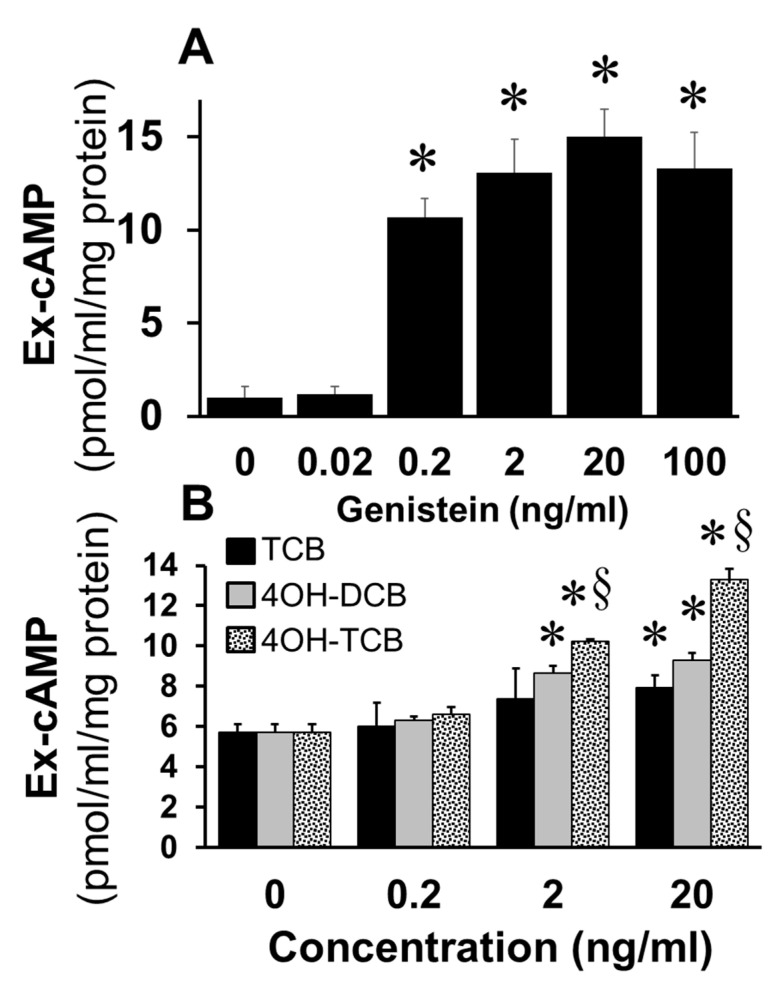
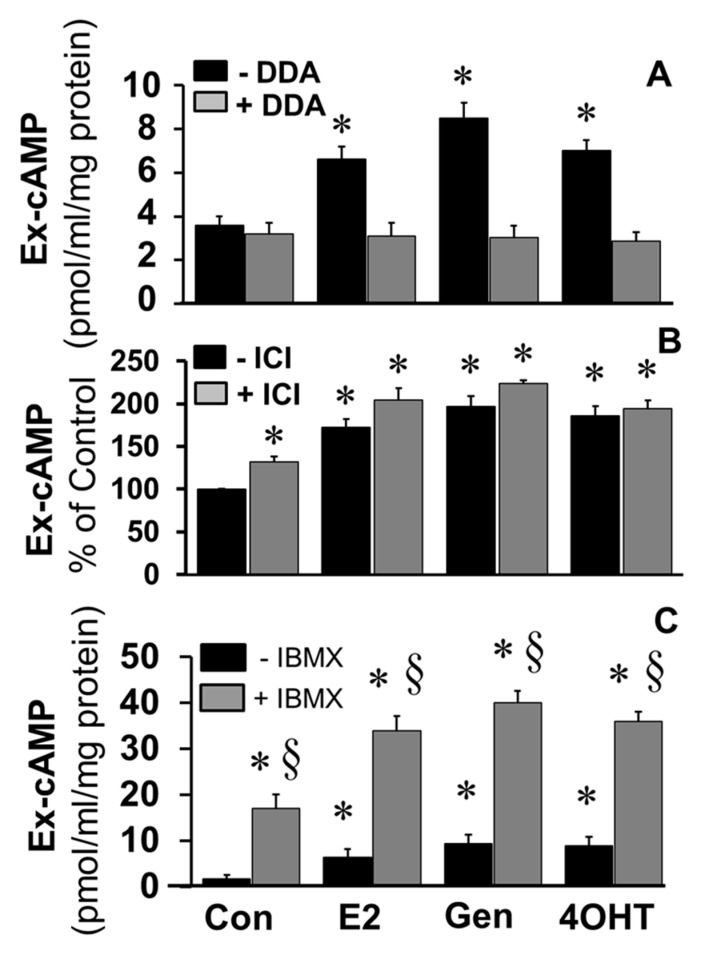
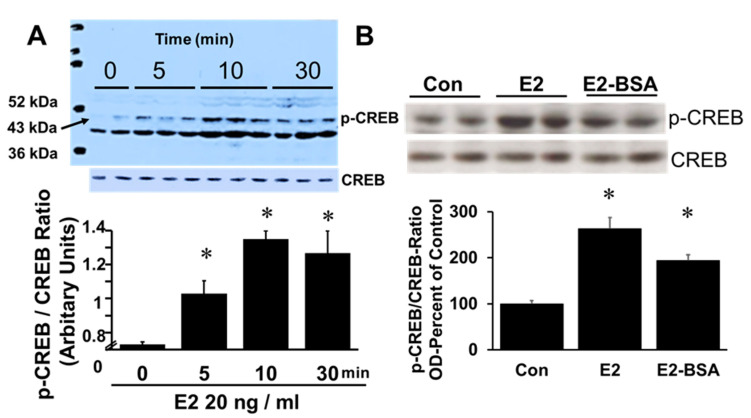
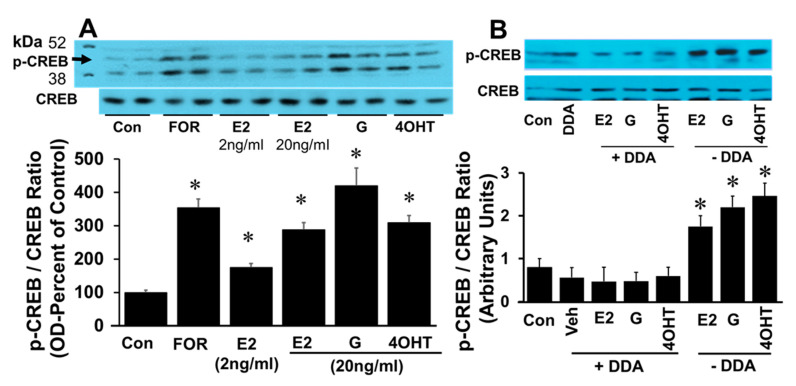
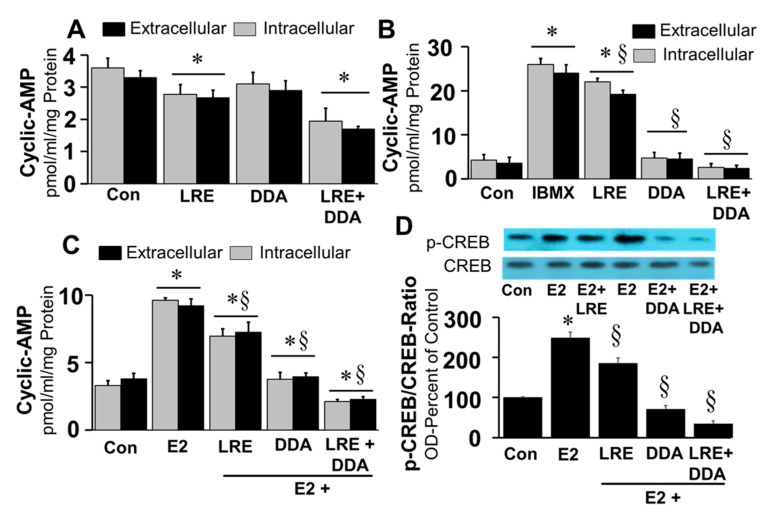
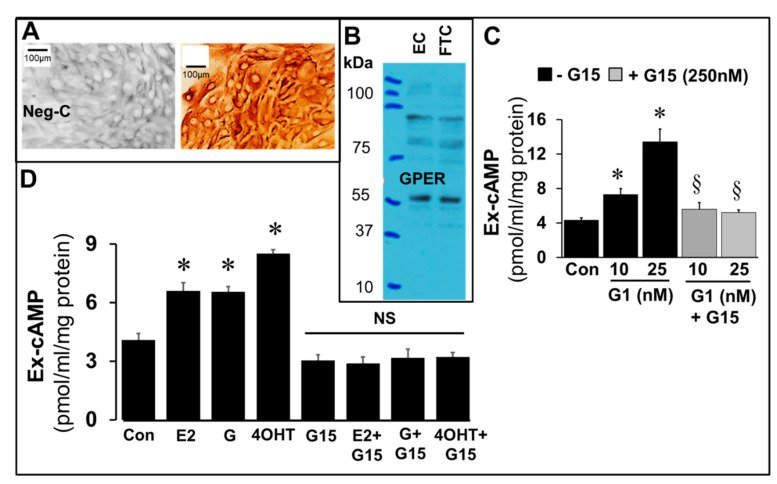
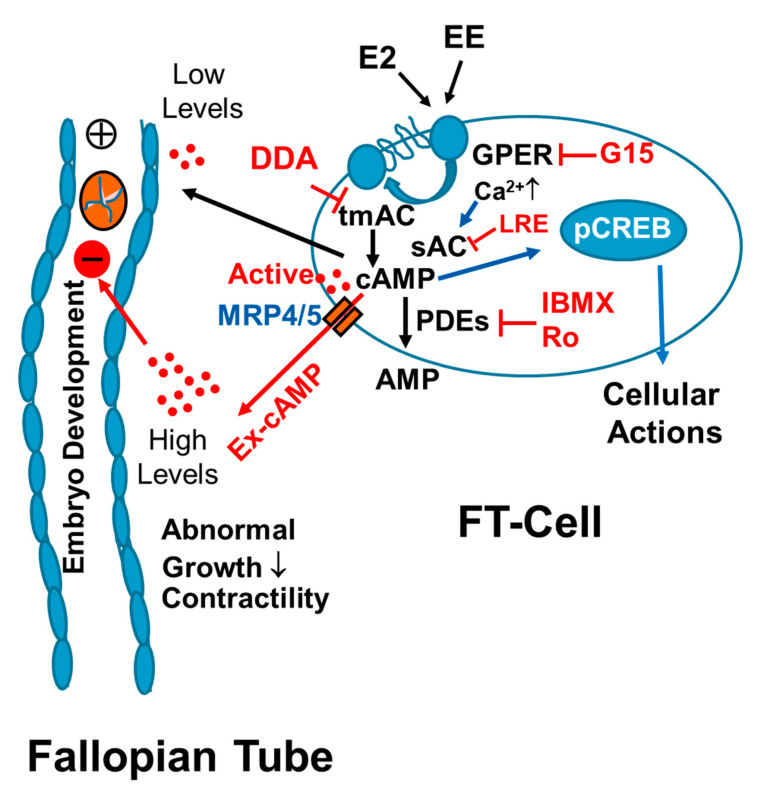
Autocrine/paracrine factors generated in response to 17β-estradiol (E2) within the fallopian tube (FT) facilitate fertilization and early embryo development for implantation. Since cyclic AMP (cAMP) plays a key role in reproduction, regulation of its synthesis by E2 may be of biological/pathophysiological relevance. Herein, we investigated whether cAMP production in FT cells (FTCs) is regulated by E2 and environmental estrogens (EE's; xenoestrogens and phytoestrogens). Under basal conditions, low levels of extracellular cAMP were detectable in bovine FTCs (epithelial cells and fibroblasts; 1:1 ratio). Treatment of FTCs with forskolin (AC; adenylyl cyclase activator), isoproterenol (β-adrenoceptor agonist) and IBMX (phosphodiesterase (PDE) inhibitor) dramatically (>10 fold) increased cAMP; whereas LRE1 (sAC; soluble AC inhibitor) and 2',5'-dideoxyadenosine (DDA; transmembrane AC (tmAC)) inhibitor decreased cAMP. Comparable changes in basal and stimulated intracellular cAMP were also observed. Ro-20-1724 (PDE-IV inhibitor), but not milrinone (PDE-III inhibitor) nor mmIBMX (PDE-I inhibitor), augmented forskolin-stimulated cAMP levels, suggesting that PDE-IV dominates in FTCs. E2 increased cAMP levels and CREB phosphorylation in FTCs, and these effects were mimicked by EE's (genistein, 4-hydroxy-2',4',6'-trichlorobiphenyl, 4-hydroxy-2',4',6'-dichlorobiphenyl). Moreover, the effects of E2 and EE were blocked by the tmAC inhibitor DDA, but not by the ERα/β antagonist ICI182780. Moreover, BAPTA-AM (intracellular-Ca2+ chelator) abrogated the effects of E2, but not genistein, on cAMP suggesting differential involvement of Ca2+. Treatment with non-permeable E2-BSA induced cAMP levels and CREB-phosphorylation; moreover, the stimulatory effects of E2 and EEs on cAMP were blocked by G15, a G protein-coupled estrogen receptor (GPER) antagonist. E2 and IBMX induced cAMP formation was inhibited by LRE1 and DDA suggesting involvement of both tmAC and sAC. Our results provide the first evidence that in FTCs, E2 and EE's stimulate cAMP synthesis via GPER. Exposure of the FT to EE's and PDE inhibitors may result in abnormal non-cyclic induction of cAMP levels which may induce deleterious effects on reproduction.

Keywords: endocrine disruptors; fallopian tube; fertilization; hormones; infertility.


Conflict of interest statement

The authors declare no conflict of interest. The funders had no role in the design of the study; in the collection, analyses, or interpretation of data; in the writing of the manuscript, or in the decision to publish the results. There is no conflict of interest, which could be perceived as prejudicing the impartiality of the research reported.

Figures

Figure 1
Figure 1
Panel (A) depicts a representative photomicrograph (40x magnification) of FT cells (mixed cultures of epithelial cells and fibroblasts 1:1 ratio). Bar graphs show the concentration-dependent stimulatory effects of treatments on extracellular (Ex) cAMP levels in confluent monolayer of FT cells after 15 min stimulation with: forskolin (0.1, 1, 10 μM), Panel (B); isoproterenol (0.1, 1, 10 μM), Panel (C); IBMX (0.1, 1, 10, 100 µM), panel (D); and IBMX (0.1–100 µM) plus isoproterenol (1 µM), Panel (E). Bar graph in Panel (F) shows changes in intracellular and extracellular cAMP levels in response to 1µM forskolin (FOR), 10 µM isoproterenol (ISO) or 1 µM IBMX. Data (mean and SEM) in bar graphs represent the mean of three different experiments (n = 3), with each experiment conducted in triplicate. Values were normalized to total protein concentration and the cAMP levels are expressed as pmol/mL/mg protein. * p < 0.05 vs. control.
Figure 2
Figure 2
Panel (A) depicts bar graph showing the effects of different PDE isoform inhibitors on forskolin-induced increases in extracellular (Ex) cAMP levels after 15 min stimulation with: IBMX (100 μM); mmIBMX (100 μM), Ro20-1724 (100 μM); and milrinone (10 μM) on cAMP production in response to forskolin (0.5 μM) by confluent monolayer of FT cells. Panel (B) depicts the concentration-dependent modulatory actions of the PDE-IV inhibitor Ro20-1724 (Ro; 0.1–500 µM) on isoproterenol (0.1 µM) induced increases in cAMP levels. Data (mean and SEM) represent the mean of three different experiments (n = 3) in triplicate. Values were normalized to total protein concentration and the cAMP level is expressed as pmol/mL/mg protein or as percent of control (* p < 0.05 vs. control).
Figure 3
Figure 3
Panel (A) shows the concentration-dependent effects of 17β-estradiol (E2; 0.2, 2, 20 ng/mL) on extracellular (Ex) cAMP levels in freshly prepared FT cells treated for 15 min. Panel (B) depicts the stimulatory effects of E2 (0.2, 2, 20, 200 ng/mL) in confluent monolayers of FT cells in the presence of the adenylyl cyclase stimulator forskolin (0.5 µM). Panel (C) shows the time-dependent increases in cAMP levels in FT cells treated for 0–180 min with IBMX (1 µM) or IBMX (1 µM) plus E2 (20 ng/mL) compared with untreated control (C) cells. Panel (D) depicts the stimulatory effects of E2 (20 ng/mL) on cAMP levels in FT cells in presence of IBMX (1 µM) after 180 min. Panel (E) shows the stimulatory effects of E2 (20 ng/mL) on cAMP levels in FT cells in presence of Ro20-1724 (1 µM) after 180 min. Panel (F) shows the stimulatory effects of E2 and its membrane impermeable analog (E2-BSA) on cAMP levels in cultured FT cells treated for 15 min. Data (mean ± SEM) represent the mean of three different experiments (n = 3) in triplicate. Values were normalized to total protein concentration and the cAMP level is expressed as pmol/mL/mg protein or as percent of control (* p < 0.05 vs. control; § p < 0.05 vs. Ro or IBMX or Forskolin alone).
Figure 4
Figure 4
Panel (A) shows the concentration-dependent effects of genistein on extracellular (Ex) cAMP production by cultured FT cells treated for 15 min. Panel (B) depicts the concentration-dependent effects of TCB, 4-OH-TCB, and 4-OH-DCB on extracellular cAMP production by cultured FT cells, treated for 15 min. Data (mean ± SEM) represent the mean of three different experiments (n = 3) in triplicate, and values were normalized to total protein concentration. The levels of cAMP are expressed as pmol/mL/mg protein. * p < 0.05 vs. control and § p < 0.05 versus TCB.
Figure 5
Figure 5
Bar graphs depicting the effects of 17β-estradiol (E2; 20 ng/mL), genistein (Gen; 20 ng/mL) and 4OH-TCB (4OHT; 20 ng/mL) on extracellular (Ex) cAMP production by FTCs stimulated for 15 min in absence or presence of: Panel (A) the transmembrane adenylyl cyclase inhibitor 2′5′-dideoxyadenosine (DDA; 10 µM); Panel (B) the estrogen receptor-αβ antagonist, ICI182780 (ICI; 1 µM); and Panel (C) the PDE inhibitor IBMX (1 µM). Data (mean ± SEM) represent the mean of three different experiments (n = 3) in triplicates. Values were normalized to total protein concentration and the cAMP levels are expressed as pmol/mL/mg protein or percent of control. * p < 0.05 vs. respective control; § p < 0.05 vs. treatment in absence of IBMX).
Figure 6
Figure 6
Panel (A) is a representative western blot showing the time-dependent (5, 10 and 30 min) phosphorylation of CREB (43 kDa protein) in response to 17β-estradiol (E2; 20 ng/mL) and Panel (B) shows a blot with CREB phosphorylation after 30 min, in response to E2 (20 ng/mL) and BSA tagged E2 (E2-BSA; 20 ng/mL). Bar graph depicts densitometric analysis for changes in CREB phosphorylation and presented in arbitrary units following normalization with non-phosphorylated CREB. Data (mean ± SEM) are from 3 separate experiments each in duplicates. Results were normalized by the internal standard, CREB. * p < 0.05 vs. 0 min or untreated control.
Figure 7
Figure 7
Panel (A) depicts a representative western blot and corresponding bar graph showing the changes in CREB phosphorylation in FT cells treated for 30 min with either forskolin (FOR; 50 μM), 17β-estradiol (E2; 2, 20 ng/mL), genistein (G; 20 ng/mL) or 4-OH-TCB (20 ng/mL). Panel (B) shows a representative western blot and corresponding bar graph depicting the modulatory effects of adenylyl cyclase inhibitor 2′,5′-dideoxyadenosine (DDA; 10 µM) on 17β-estradiol (E2; 20 ng/mL), genistein (G; 20 ng/mL) and 4OH-TCB (4OHT; 20 ng/mL) induced CREB phosphorylation in FT cells. Data represent (mean ± SEM) from separate experiments (n = 3). Results for phosphorylated CREB were normalized, with non-phosphorylated CREB and change in OD expressed as arbitrary units or percent of control. * p < 0.05 vs. untreated control, Con).
Figure 8
Figure 8
Panel (A) depicts, a representative western blot and corresponding bar graph showing the modulatory effects of the ERα/β antagonist ICI182780 (ICI; 1 µM) on 17β-estradiol (E2; 20 ng/mL), genistein (Gen; 20 ng/mL) and 4OH-TCB (4OHT; 20 ng/mL) induced CREB phosphorylation after treatment for 30 min. Panel (B) depicts a representative western blot and corresponding bar graph showing the modulatory actions of the intracellular Ca2+ chelator BAPTA-AM (1 µM) on 17β-estradiol (E2; 20 ng/mL), genistein (G; 20 ng/mL) and 4OH-TCB (4OHT; 20 ng/mL) induced CREB phosphorylation in FT cells incubated for 30 min. Data (mean ± SEM) represent the mean of three different experiments (n = 3). Results for phosphorylated CREB were normalized with non-phosphorylated CREB and expressed as percent of control. * p < 0.05 vs. untreated control, Con; § p < 0.05 vs. treatment without BAPTA-AM.
Figure 9
Figure 9
Figure depicting the inhibitory effects of sAC inhibitor, LRE1 (50 µM), tmAC inhibitor DDA (10 µM) and LRE1 (50 µM) plus DDA (10 µM) on basal (Panel (A)), IBMX (1 µM, Panel (B)); and E2 (20 ng/mL, Panel (C)), stimulated changes in intracellular and extracellular cyclic AMP levels in FT cells after treatment for 15 min. Panel (D) shows the effects of LRE1 (50 µM), DDA (10 µM) and LRE1 (50 µM) plus DDA (10 µM) on E2 (20 ng/mL) induced phosphorylation of CREB in FT cells treated for 30 min. Data for cAMP (mean ± SEM) represent the mean of three different experiments in triplicate (n = 3). Results for phosphorylated CREB were normalized with non-phosphorylated CREB and expressed as percent of control. * p < 0.05 vs. untreated control, Con; § p < 0.05 vs. treatment with E2, IBMX, LRE or DDA alone.
Figure 10
Figure 10
Panel (A) depicts representative photomicrographs (40× magnification) of bovine fallopian tube cells (FT cells; mixed cultures of epithelial cells and fibroblasts at 1:1 ratio). The photomicrograph on right depicts FT cells with positive staining for GPER whereas the left photomicrograph depicts the negative control (neg-C). Panel (B) shows a western blot for GPER (≈55 kDa) in FT cells (FTC) and vascular endothelial cells (EC). The bar graph in Panel (C) depicts the inhibitory effects of G15 (GPER antagonist; 250 nM) on extracellular (Ex) cAMP levels induced by G1 (25 nM) whereas Panel (D) shows the inhibitory effects of G15 (250 nM) on 17β-estradiol (E2; 20 ng/mL), genistein (G; 20 ng/mL) and 4OH-TCB (4OHT; 20 ng/mL). Data (mean and SEM) represent the mean of three different experiments (n = 3) in triplicates. Values were normalized to total protein concentration and cAMP level expressed as pmol/mL/mg protein. * p < 0.05 vs. control; § p < 0.05 vs. treatment with E2, IBMX, LRE or DDA alone.
Figure 11
Figure 11
A schematic cartoon depicting the mechanism via which natural estrogens (E2) and environmental estrogens (EE) activate cyclic AMP (cAMP) generation by oviduct cells. Intracellular cAMP can mediate its cellular actions by phosphorylating CREB, and phosphodiesterases (PDEs) can metabolize/breakdown intracellular cAMP to AMP; moreover, cAMP is transported out of the cells by multidrug resistance-associated protein 4 and 5 (MRP4; MRP5). Using the G-protein coupled estrogen receptor (GPER) antagonist G15, transmembrane adenylyl cyclase (tmAC) inhibitor 2′5′-dideoxyadenosine (DDA) and soluble AC (sAC) inhibitor LRE1 (LRE), we demonstrate that in FT cells E2 and EE induce cAMP production via GPER/AC signaling. Since cAMP is a potent muscle relaxant and growth inhibitor, we hypothesize that increased generation of intracellular cAMP and extracellular cAMP (ex-cAMP) in a non-cyclic fashion may induce deleterious actions on early embryo development and transport through FT. Importantly the effects of both E2 and EE may be significantly enhanced in presence of PDE inhibitors such as the anti-inflammatory drugs rolipram (Ro) and IBMX or food products containing caffeine. Changes in cAMP levels may play an important role in early embryo development and its transport.

Similar articles

Cited by

References

    1. Li S., Winuthayanon W. Oviduct: Roles in fertilization and early embryo development. J. Endocrinol. 2017;232:R1–R26. doi: 10.1530/JOE-16-0302. - DOI - PubMed
    1. Cometti B.S., Dubey R.K., Imthurn B., Rosselli M. Natural and environmental oestrogens induce TGFB1 synthesis in oviduct cells. Reproduction. 2018;155:233–244. doi: 10.1530/REP-17-0425. - DOI - PubMed
    1. Almiñana C., Tsikis G., Labas V., Uzbekov R., da Silveira J.C., Bauersachs S., Mermillod P. Deciphering the oviductal extracellular vesicles content across the estrous cycle: Implications for the gametes-oviduct interactions and the environment of the potential embryo. BMC Genom. 2018;19:622. doi: 10.1186/s12864-018-4982-5. - DOI - PMC - PubMed
    1. Sayner S.L., Choi C.-S., Maulucci M.E., Ramila K.C., Zhou C., Scruggs A.K., Yarbrough T., Blair L.A., King J.A., Seifert R., et al. 2019 Extracellular vesicles: Another compartment for the second messenger, cyclic adenosine monophosphate. Am. J. Physiol. Lung Cell Mol. Physiol. 2019:L691–L700. doi: 10.1152/ajplung.00282.2018. - DOI - PMC - PubMed
    1. Gilchrist R.B., Luciano A.M., Richani D., Zeng H.T., Wang X., De Vos M., Sugimura S., Smitz J., Richard F.J., Thompson J.G. Oocyte maturation and quality: Role of cyclic nucleotides. Reproduction. 2016;152:R143–R157. doi: 10.1530/REP-15-0606. - DOI - PubMed

Publication types

MeSH terms