. 2021 May 19;22(10):5336.
doi: 10.3390/ijms22105336.

Contribution of Syndecans to the Cellular Entry of SARS-CoV-2

Affiliations

Contribution of Syndecans to the Cellular Entry of SARS-CoV-2

Anett Hudák et al. Int J Mol Sci. .

Abstract

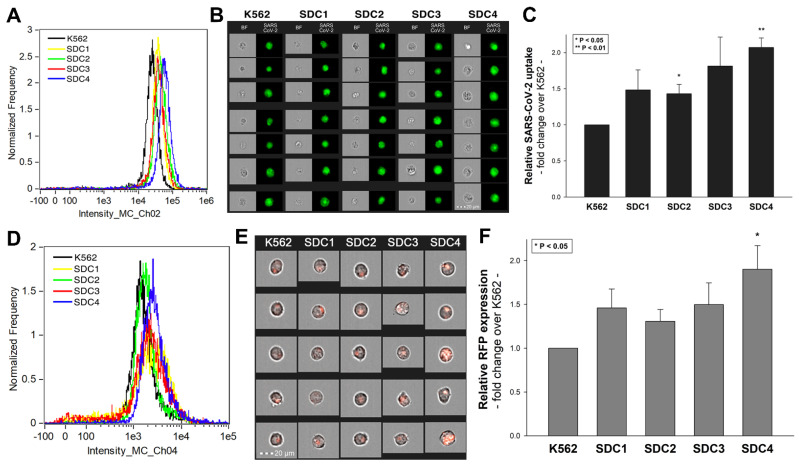
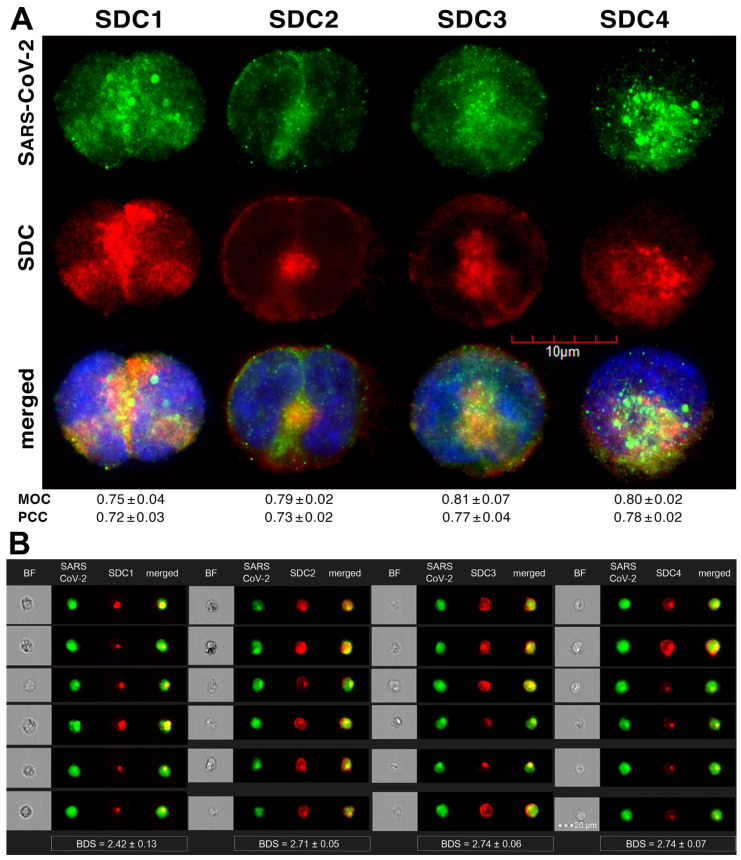
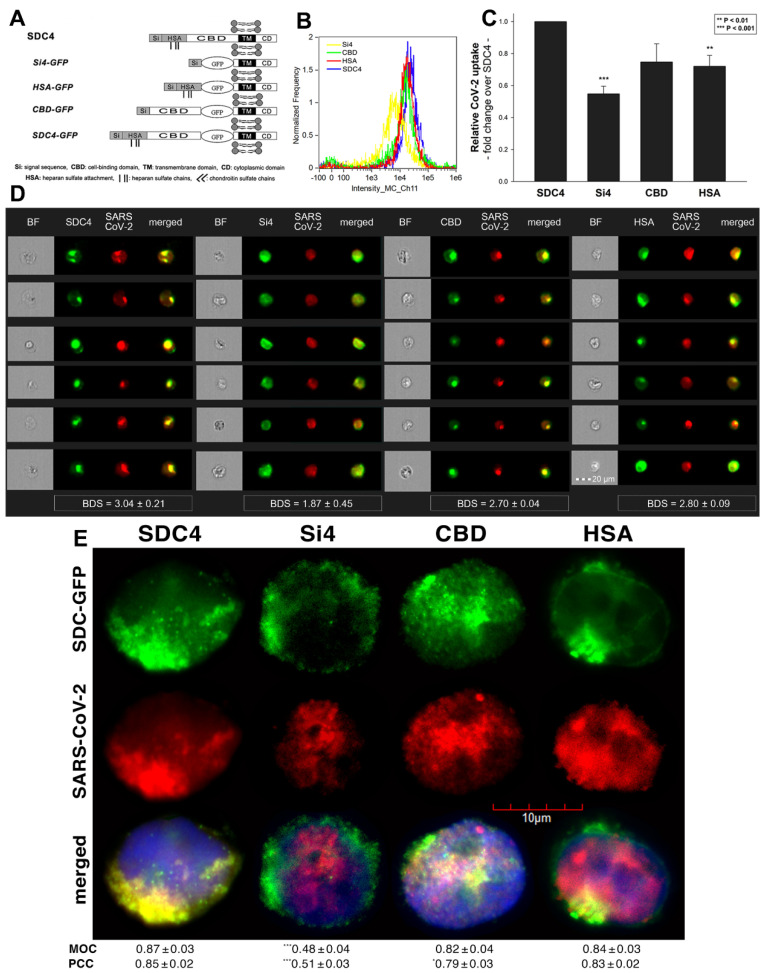
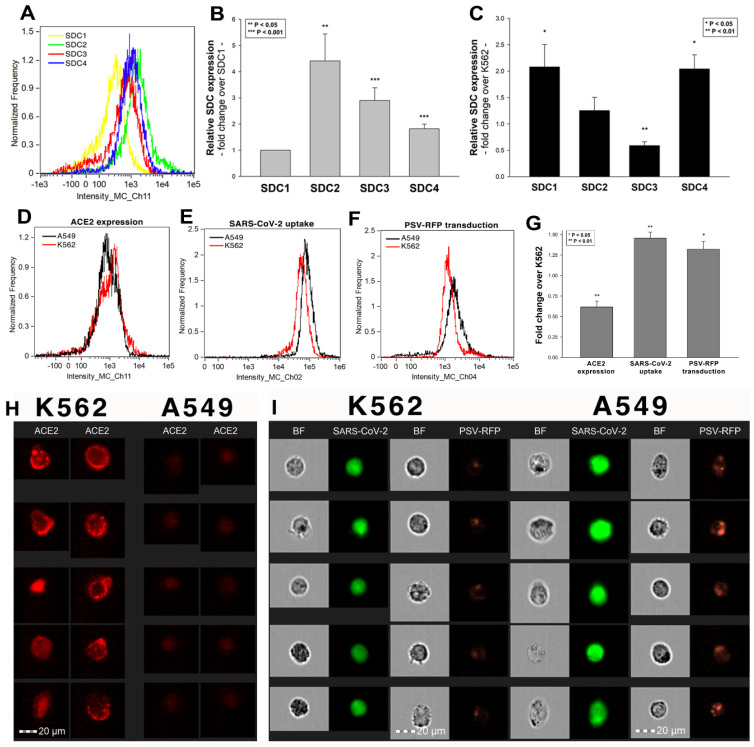
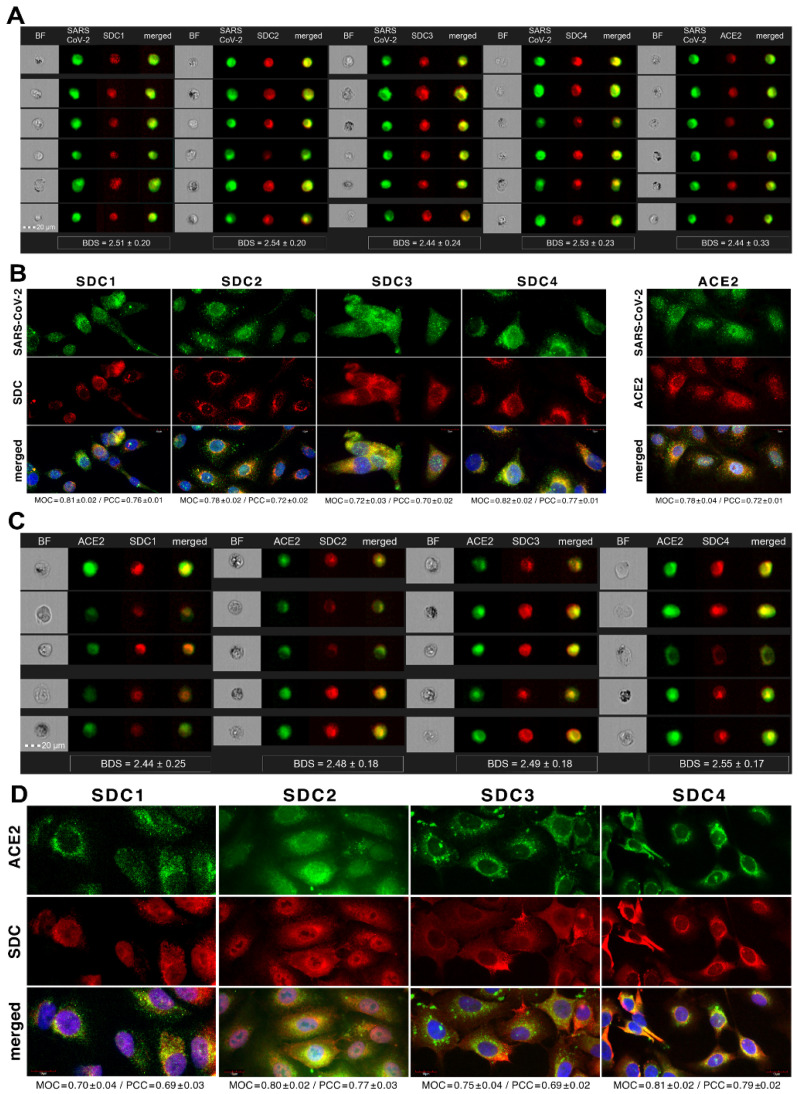
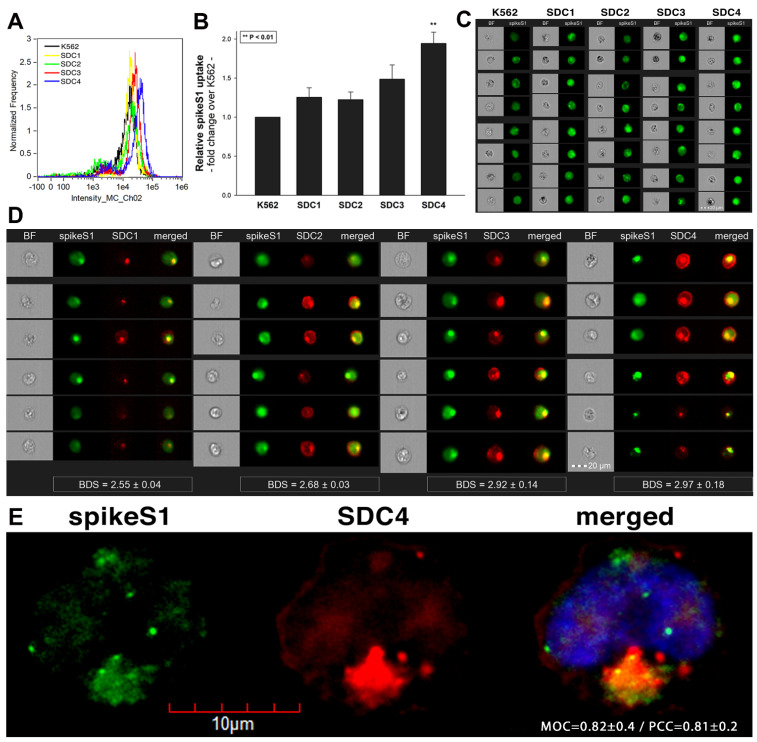
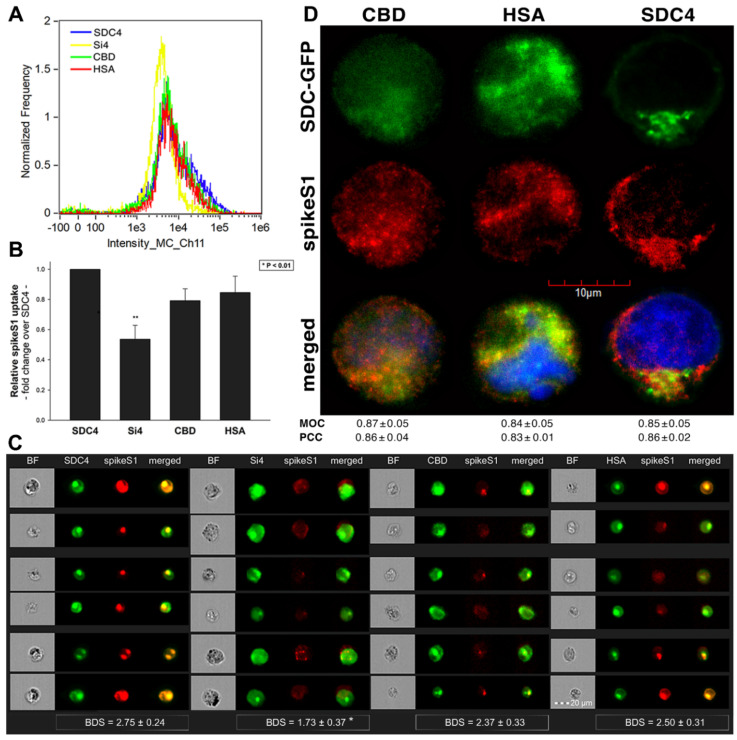
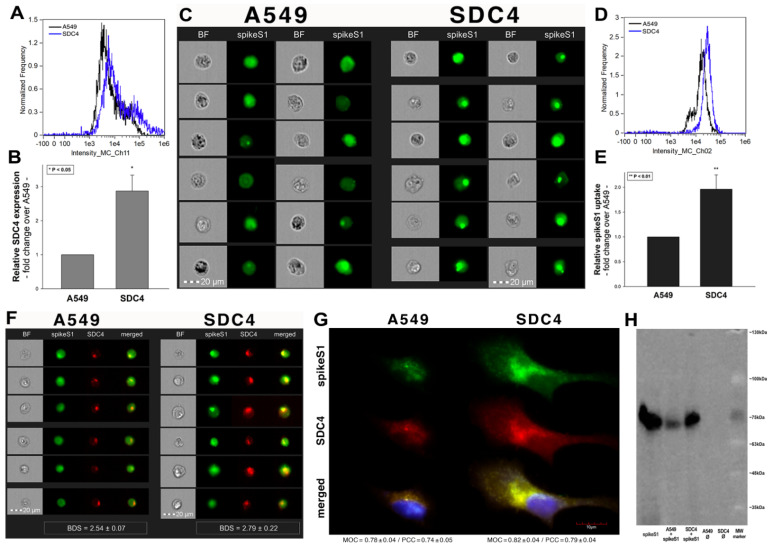
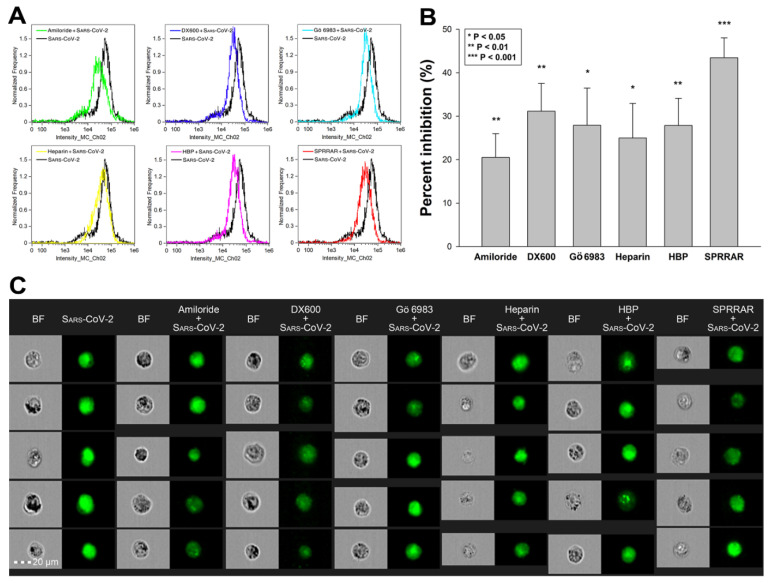
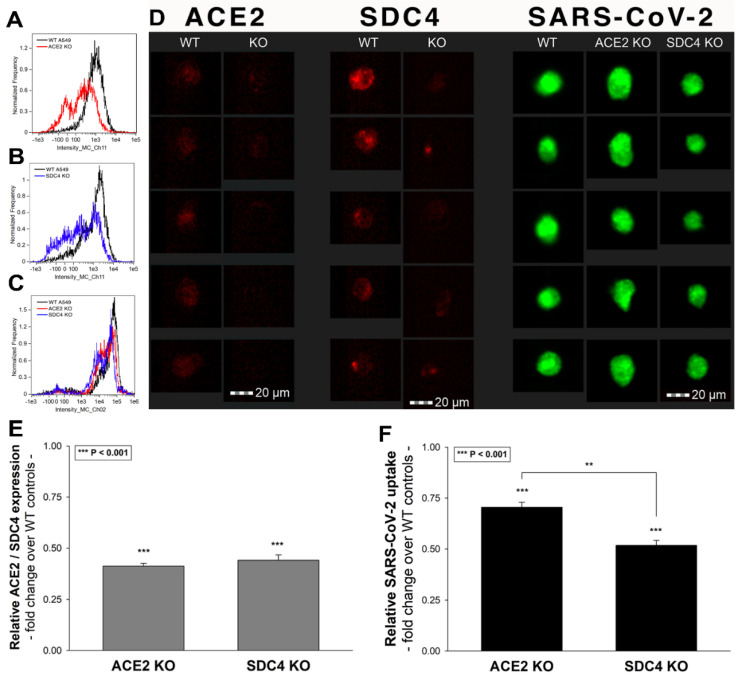
The severe acute respiratory syndrome coronavirus 2 (SARS-CoV-2) is a novel emerging pathogen causing an unprecedented pandemic in 21st century medicine. Due to the significant health and economic burden of the current SARS-CoV-2 outbreak, there is a huge unmet medical need for novel interventions effectively blocking SARS-CoV-2 infection. Unknown details of SARS-CoV-2 cellular biology hamper the development of potent and highly specific SARS-CoV-2 therapeutics. Angiotensin-converting enzyme-2 (ACE2) has been reported to be the primary receptor for SARS-CoV-2 cellular entry. However, emerging scientific evidence suggests the involvement of additional membrane proteins, such as heparan sulfate proteoglycans, in SARS-CoV-2 internalization. Here, we report that syndecans, the evolutionarily conserved family of transmembrane proteoglycans, facilitate the cellular entry of SARS-CoV-2. Among syndecans, the lung abundant syndecan-4 was the most efficient in mediating SARS-CoV-2 uptake. The S1 subunit of the SARS-CoV-2 spike protein plays a dominant role in the virus's interactions with syndecans. Besides the polyanionic heparan sulfate chains, other parts of the syndecan ectodomain, such as the cell-binding domain, also contribute to the interaction with SARS-CoV-2. During virus internalization, syndecans colocalize with ACE2, suggesting a jointly shared internalization pathway. Both ACE2 and syndecan inhibitors exhibited significant efficacy in reducing the cellular entry of SARS-CoV-2, thus supporting the complex nature of internalization. Data obtained on syndecan specific in vitro assays present syndecans as novel cellular targets of SARS-CoV-2 and offer molecularly precise yet simple strategies to overcome the complex nature of SARS-CoV-2 infection.

Keywords: SARS-CoV-2; cellular entry; coronaviruses; spike protein; syndecans.


Conflict of interest statement

The authors declare no conflict of interest.

Figures

Figure 1
Figure 1
Cellular entry of SARS-CoV-2 into SDC transfectants. WT K562 cells and SDC transfectants were incubated with heat-inactivated SARS-CoV-2 (at 1 MOI) for 18 h at 37 °C. After incubation, the cells were washed, trypsinized, fixed, permeabilized and treated with antibodies specific for the spike glycoprotein (along with secondary AF 488-labeled antibodies). Cellular uptake of SARS-CoV-2 was then analyzed with imaging flow cytometry and confocal microscopy. (A) Representative flow cytometry histograms showing the intracellular fluorescence of SARS-CoV-2-treated WT K562 cells and SDC transfectants. (B) Brightfield (BF) and fluorescent cellular images of SARS-CoV-2-treated WT K562 cells and SDC transfectants. Scale bar = 20 μm. (C) Detected fluorescence intensities were normalized to SARS-CoV-2-treated WT K562 cells as standards. The bars represent the mean ± SEM of four independent experiments. Statistical significance vs. standards was assessed with analysis of variance (ANOVA). * p < 0.05; ** p < 0.01. (DF) Contribution of SDCs to SARS-CoV-2 PSV-mediated gene transduction. WT K562 cells and stable SDC transfectants were incubated with 1 × 10⁵ transducing units of SARS-CoV-2 PSV-RFP. RFP expression was analyzed 72 h later with imaging flow cytometry. (D) Representative flow cytometry histograms showing RFP fluorescence of WT K562 cells and SDC transfectants, following 72 h incubation with SARS-CoV-2 PSV. (E) Cellular images of SARS-CoV-2 PSV-treated WT K562 cells and SDC transfectants as detected with imaging flow cytometry. Scale bar = 20 μm. (F) Detected cellular RFP intensities were normalized to SARS-CoV-2 PSV-treated WT K562 cells as standards. The bars represent the mean ± SEM of four independent experiments. Statistical significance vs. standards was assessed with ANOVA. * p < 0.05.
Figure 2
Figure 2
SARS-CoV-2 colocalizes with SDCs during cellular entry. WT K562 cells and SDC transfectants were incubated with heat-inactivated SARS-CoV-2 (at 1 MOI) for 18 h at 37 °C. After incubation, the cells were washed, trypsinized, fixed, permeabilized and treated with antibodies specific for the spike glycoprotein (along with secondary AF 488-labeled antibodies) and APC-labeled SDC antibodies. Colocalization of SARS-CoV-2 with SDCs was analyzed with confocal microscopy and imaging flow cytometry. (A) Microscopic analyses of SARS-CoV-2 and SDC colocalization. Representative images of three independent experiments are shown. Scale bar = 10 μm. The MOC and PCC ± SEM for the overlap and colocalization of SDC with SARS-CoV-2 (indicated below the images) were calculated by analyzing 15 images with an average of 10 cells in each image (from 3 separate samples). (B) BF and fluorescent images of SARS-CoV-2-treated SDC transfectants. Scale bar = 20 μm. The indicated BDS values of SARS-CoV-2 and SDCs represent mean ± SEM of four independent experiments.
Figure 3
Figure 3
Contribution of the various parts of the SDC4 ectodomain to SARS-CoV-2 uptake. GFP-tagged SDC4 mutants incubated with SARS-CoV-2 (at 1 MOI) for 18 h were fixed, permeabilized and treated with specific and AF 633-labeled SARS-CoV-2 antibodies. Cellular uptake was analyzed with imaging flow cytometry and confocal microscopy. (A) Schematic representation of the applied SDC4 mutants. (B) Representative flow cytometry histograms showing the intracellular fluorescence of SARS-CoV-2-treated SDC4 transfectants and mutants. (C) Detected fluorescence intensities were normalized to SARS-CoV-2-treated transfectants expressing WT SDC4 as standards. The bars represent the mean ± SEM of four independent experiments. Statistical significance vs. standards was assessed with ANOVA. ** p < 0.01; *** p < 0.01. (D) BF and fluorescent images of SARS-CoV-2-treated SDC4 mutants. Scale bar = 20 μm. The indicated BDS values of SARS-CoV-2 and SDCs represent the mean ± SEM of four independent experiments. Statistical significance between the SDC4 mutants was assessed with ANOVA. (E) Confocal microscopic visualization of SARS-CoV-2-treated SDC4, Si4, CBD and HSA transfectants. Scale bar = 10 μm. MOC ± SEM and PCC ± SEM for the overlap and colocalization of SARS-CoV-2 with SDC4, Si4, CBD and HSA (indicated below the images) was calculated by analysis of 15 images with ~10 cells in each image (from 3 separate samples). Statistical significance vs. SARS-CoV-2-treated transfectants expressing WT SDC4 (standards) was assessed with ANOVA. * p < 0.05, *** p < 0.001.
Figure 4
Figure 4
The difference of SARS-CoV-2 internalization in A549 and K562 cells. WT A549 and K562 cells were incubated with heat-inactivated SARS-CoV-2 (at 1 MOI) for 18 h at 37 °C. After incubation, the cells were washed, trypsinized, fixed, permeabilized and treated with antibodies specific for the spike glycoprotein (along with AF 488-labeled secondary antibodies). Cellular uptake of SARS-CoV-2 was then analyzed with imaging flow cytometry. Other A549 and K562 cells were also incubated with 1 × 10⁵ transducing units of SARS-CoV-2 PSV-RFP for 72 h. RFP expression was then measured with imaging flow cytometry. To investigate the effect of ACE2 and SDC expression on SARS-CoV-2 uptake, ACE2 and SDC expression of WT A549 and K562 cells (all untreated with SARS-CoV-2) were also analyzed with flow cytometry by using fluorescently labeled antibodies specific for ACE2 and SDC isoforms. (A) Representative flow cytometry histograms showing the expression levels of SDC isoforms in WT A549 cells. (B) Detected SDC expression levels in A549 cells were normalized to that of SDC1. The bars represent the mean ± SEM of nine independent experiments. Statistical significance vs. SDC1 expression was assessed with ANOVA. ** p < 0.01; *** p < 0.001. (C) SDC expression of WT A549 and K562 cells was measured with flow cytometry. Detected SDC expression levels in A549 cells were normalized to that of K562 cells as standards. The bars represent the mean ± SEM of three independent experiments. Statistical significance vs. standards was assessed with ANOVA. * p < 0.05; ** p < 0.01. (D) Representative flow cytometry histograms showing the ACE2 expression levels in WT K562 and A549 cells. (E) Representative flow cytometry histograms showing the intracellular fluorescence of SARS-CoV-2-treated WT K562 and A549 cells. (F) Representative flow cytometry histograms showing the RFP fluorescence of SARS-CoV-2 PSV-treated WT K562 and A549 cells. (G) ACE2 and RFP expression and SARS-CoV-2 internalization levels were normalized to those of WT K562 cells as standards. The bars represent the mean ± SEM of three independent experiments. Statistical significance vs. standards (WT K562 cells) was assessed with ANOVA. * p < 0.05; ** p < 0.01. (H) Fluorescent images representing the ACE2 expression of K562 and A549 cells. Scale bar = 20 μm. (I) BF and fluorescent images of SARS-CoV-2- and SARS-CoV-2 PSV-treated K562 and A549 cells. Scale bar = 20 μm.
Figure 5
Figure 5
SARS-CoV-2 colocalizes with both SDCs and ACE2 during its uptake in A549 cells. WT A549 cells were incubated with heat-inactivated SARS-CoV-2 (at 1 MOI) for 18 h at 37 °C. After incubation, the cells were treated with, in case of the SARS-CoV-2/SDC colocalization studies, antibodies specific for the spike glycoprotein (along with AF 488-labeled secondary antibody) and APC-labeled SDC antibodies. Colocalization of SARS-CoV-2 and ACE2 was analyzed by using AF 647-labeled antibody against ACE2. For analyzing colocalization between SDCs and ACE2, the SARS-CoV-2-treated cells, after incubation, were treated with AF 488-labeled antibodies against ACE2 and APC-labeled SDC antibodies. Colocalization of SARS-CoV-2 with SDCs and ACE2, or SDCs with ACE2, was then analyzed with imaging flow cytometry and confocal microscopy. (A) Imaging flow cytometry visualization of colocalization between SARS-CoV-2 and SDCs and ACE2 in SARS-CoV-2-treated A549 cells. Representative images of four independent experiments are shown. Scale bar = 20 μm. BDS of SARS-CoV-2 and SDCs (or ACE2) represent the mean ± SEM of four independent experiments. Statistical significance between the groups was assessed with ANOVA (no statistically significant differences were detected). (B) Confocal microscopy visualization of colocalization between SARS-CoV-2 and SDCs or ACE2 in SARS-CoV-2-treated WT A549 cells. Representative images of four independent experiments are shown. Scale bar = 10 μm. MOC ± SEM and PCC ± SEM for the overlap and colocalization of SARS-CoV-2 with either of the SDC isoforms and ACE2 (indicated below each image) were calculated by analyzing 15 images with ~10 cells in each image (from 3 separate samples). (C) Imaging flow cytometry visualization of colocalization between ACE2 and SDCs in SARS-CoV-2-treated WT A549 cells. Representative images of four independent experiments are shown. Scale bar = 20 μm. The indicated BDS of ACE2 and SDCs represent the mean ± SEM of four independent experiments. (D) Confocal microscopy visualization of colocalization between ACE2 and SDCs in SARS-CoV-2-treated WT A549 cells. Representative images of four independent experiments are shown. Scale bar = 10 μm. MOC ± SEM and PCC ± SEM for the overlap and colocalization of ACE2 and SDCs (indicated below each image) were calculated by analyzing 15 images with ~10 cells in each image (from 3 separate samples).
Figure 6
Figure 6
Cellular uptake of spikeS1 into SDC transfectants. WT K562 cells and SDC transfectants were incubated with spikeS1 for 18 h at 37 °C. After incubation, the cells were washed, trypsinized, fixed, permeabilized and treated with FITC-labeled antibodies specific for the N-terminal His-tag of the recombinant spikeS1. Cellular uptake of spikeS1 was then analyzed with imaging flow cytometry and confocal microscopy. (A) A representative flow cytometry histogram showing the intracellular fluorescence of spikeS1-treated WT K562 cells and SDC transfectants. (B) Detected fluorescence intensities were normalized to spikeS1-treated WT K562 cells as standards. The bars represent the mean ± SEM of three independent experiments. Statistical significance vs. standards was assessed with ANOVA. ** p < 0.01. (C) BF and fluorescent cellular images of spikeS1-treated WT K562 cells and SDC transfectants. Scale bar = 20 μm. (D) Imaging flow cytometry visualization of colocalization between SDCs and spikeS1. Representative images of four independent experiments are shown. Scale bar = 20 μm. The indicated BDS of spikeS1 and SDCs represent the mean ± SEM of four independent experiments. Statistical significance between the groups was assessed with ANOVA. No statistically significant differences were detected. (E) Colocalization of spikeS1 and SDC4 detected with confocal microscopy. Representative images of three independent experiments are shown. Scale bar = 10 μm. MOC ± SEM and PCC ± SEM for the overlap and colocalization of SDC4 with spikeS1 (indicated on the image) was calculated by analyzing 12 images with an average of 12 cells in each image (from 3 separate samples).
Figure 7
Figure 7
Contribution of the various parts of the SDC4 ectodomain to spikeS1 uptake. SDC4 transfectants and mutants were incubated with spikeS1 for 18 h at 37 °C. After incubation, the cells were washed, trypsinized, fixed, permeabilized and treated with AF 633-labeled antibodies specific for the His-tag of the recombinant spikeS1. Cellular uptake of spikeS1 was then analyzed with imaging flow cytometry and confocal microscopy. (A) A representative flow cytometry histogram showing the intracellular fluorescence of spikeS1-treated SDC4 transfectants and mutants. (B) Detected fluorescence intensities were normalized to spikeS1-treated WT SDC4 transfectants as standards. The bars represent the mean ± SEM of three independent experiments. Statistical significance vs. standards was assessed with ANOVA. ** p < 0.01. (C) Imaging flow cytometry visualization of colocalization between SDC4 mutants and spikeS1. Representative images of four independent experiments are shown. Scale bar = 20 μm. The indicated BDS represent the mean ± SEM of four independent experiments. Statistical significance vs. spikeS1-treated SDC4 transfectants was assessed with ANOVA. * p < 0.05. (D) Colocalization of spikeS1 and SDC4 mutants detected with confocal microscopy. Representative images of three independent experiments are shown. Scale bar = 10 μm. MOC ± SEM and PCC ± SEM fwas calculated by analyzing 12 images with an average of 12 cells in each image (from 3 separate samples). No statistically significant differences were detected between the groups.
Figure 8
Figure 8
SDC4 overexpression increases spikeS1 uptake in A549 cells. WT A549 cells and SDC4 transfectants (created in A549 cells) were incubated with recombinant spikeS1 for 18 h at 37 °C. After incubation, spikeS1-treated cells were trypsinized, fixed, permeabilized and treated with fluorescently labeled anti-His tag antibodies. After antibody treatment, intracellular fluorescence was analyzed with either imaging flow cytometry or confocal microscopy. (A,B) SDC4 expression measured with flow cytometry by using APC-labeled SDC4 antibodies. (A) Representative flow cytometry histograms showing SDC4 expression levels of WT A549 cells and SDC4 transfectants. (B) Detected SDC4 expression levels were normalized to those of WT A549 cells as standards. The bars represent the mean ± SEM of three independent experiments. Statistical significance vs. standards was assessed with ANOVA. * p < 0.05. (C) Cellular images representing intracellular fluorescence of spikeS1-treated WT A549 cells and SDC4 transfectants. (D,E) SDC4 overexpression increases spikeS1 uptake. (D) Representative flow cytometry histograms showing the intracellular fluorescence of spikeS1-treated WT A549 cells and SDC4 transfectants. (E) Fold change in spikeS1 uptake following SDC4 overexpression. The bars represent the mean ± SEM of three independent experiments. Statistical significance vs. spikeS1-treated WT A549 cells as standards was assessed with ANOVA. ** p < 0.01. (F) Colocalization of spikeS1 in WT A549 cells and SDC4 transfectants as detected with imaging flow cytometry. The indicated BDS between spikeS1 and SDC4 represents the mean ± SEM of three independent experiments. (G) Confocal microscopy visualization of colocalization between spikeS1 and SDC4 in WT A549 cells and SDC4 transfectants. Representative images of three independent experiments are shown. Scale bar = 10 μm. The MOC ± SEM and PCC ± SEM for the overlap and colocalization of SDC4 with spikeS1 are indicated in the images. The MOC and PCC values were calculated by analyzing 12 images with an average of 12 cells in each image (from 3 separate samples). (H) A representative Western blot showing spikeS1 immunoprecipitated with SDC4 in WT A549 cells and SDC4 transfectants. Lane 1: 0.5 µg of spikeS1; lanes 2–3: immunoprecipitates of spikeS1-treated WT A549 cells and SDC4 transfectants, respectively; lanes 4–5: immunoprecipitate of WT A549 cells and SDC4 transfectants untreated with spikeS1 (controls). Standard protein size markers are indicated on the right.
Figure 9
Figure 9
Effects of ACE2 or SDC4 inhibition on SARS-CoV-2 uptake in A549 cells. (A) Cellular images of SARS-CoV-2-treated WT A549 cells preincubated with or without either of the inhibitors: amiloride, DX600, Gö 6983, heparin, HBP and SPRRAR. After 18 h of incubation, the cells were washed, trypsinized, fixed, permeabilized and treated with antibodies specific for the spike glycoprotein (along with AF 488-labeled secondary antibody). Intracellular fluorescence was then analyzed with imaging flow cytometry. (B) Flow cytometry histograms representing intracellular fluorescence of SARS-CoV-2-treated WT A549 cells preincubated with or without any inhibitors. (C) The effect of an inhibitor was expressed as percent inhibition, calculated with the following formula: [(X − Y)/X] × 100, where X is the fluorescence intensity obtained on cells treated with SARS-CoV-2 in the absence of the inhibitor, and Y is the fluorescence intensity obtained on cells treated with SARS-CoV-2 in the presence of the inhibitor. The bars represent the mean ± SEM of four independent experiments. Statistical significance vs. controls treated with SARS-CoV-2 in the absence of the inhibitor was assessed with ANOVA. * p < 0.05; ** p < 0.01; *** p < 0.001.
Figure 10
Figure 10
Effect of ACE2 or SDC4 knockdown on SARS-CoV-2 cellular entry. SDC4 and ACE2 knockdown in A549 cells was performed using a lentiviral vector system specific to human ACE2 and SDC4 shRNA. Stable KO cells were then selected, and along with WT A549 cells, were incubated with heat-inactivated SARS-CoV-2 (at 1 MOI) for 18 h at 37 °C. (A,B) Representative flow cytometry histograms showing ACE2 and SDC4 expression levels of WT A549, ACE2 (A) and SDC4 KO (B) cells. (C) Representative flow cytometry histograms showing the intracellular fluorescence of SARS-CoV-2-treated WT A549, ACE2 KO and SDC4 KO cells. (D) Imaging flow cytometry visualization of ACE2 and SDC4 expression, along with SARS-CoV-2 internalization of WT A549, ACE2 KO and SDC4 KO cells. Representative images of four independent experiments are shown. Scale bar = 20 μm. (E) Relative ACE2 and SDC4 expression levels of ACE2 KO and SDC4 KO cells. Detected ACE2 and SDC4 expression levels were normalized to those of WT A549 cells as standards. The bars represent the mean ± SEM of three independent experiments. Statistical significance vs. standards was assessed with analysis of variance (ANOVA). *** p < 0.001. (F) Detected intracellular fluorescence intensities of SARS-CoV-2-treated ACE2 and SDC4 KO cells were normalized to SARS-CoV-2-treated WT A549 cells as standards. The bars represent the mean ± SEM of three independent experiments. Statistical significance vs. standards (i.e., SARS-CoV-2-treated WT A549 cells) and between ACE2 and SDC4 KO cells were assessed with ANOVA. ** p < 0.01; *** p < 0.001.

Similar articles

Cited by

References

    1. El Zowalaty M.E., Jarhult J.D. From SARS to COVID-19: A previously unknown SARS- related coronavirus (SARS-CoV-2) of pandemic potential infecting humans—Call for a One Health approach. One Health. 2020;9:100124. doi: 10.1016/j.onehlt.2020.100124. - DOI - PMC - PubMed
    1. Chu D.K.W., Pan Y., Cheng S.M.S., Hui K.P.Y., Krishnan P., Liu Y., Ng D.Y.M., Wan C.K.C., Yang P., Wang Q., et al. Molecular Diagnosis of a Novel Coronavirus (2019-nCoV) Causing an Outbreak of Pneumonia. Clin. Chem. 2020;66:549–555. doi: 10.1093/clinchem/hvaa029. - DOI - PMC - PubMed
    1. Coronaviridae Study Group of the International Committee on Taxonomy of, V The species Severe acute respiratory syndrome-related coronavirus: Classifying 2019-nCoV and naming it SARS-CoV-2. Nat. Microbiol. 2020;5:536–544. doi: 10.1038/s41564-020-0695-z. - DOI - PMC - PubMed
    1. Malik Y.S., Sircar S., Bhat S., Sharun K., Dhama K., Dadar M., Tiwari R., Chaicumpa W. Emerging novel coronavirus (2019-nCoV)-current scenario, evolutionary perspective based on genome analysis and recent developments. Vet. Q. 2020;40:68–76. doi: 10.1080/01652176.2020.1727993. - DOI - PMC - PubMed
    1. Boni M.F., Lemey P., Jiang X., Lam T.T., Perry B.W., Castoe T.A., Rambaut A., Robertson D.L. Evolutionary origins of the SARS-CoV-2 sarbecovirus lineage responsible for the COVID-19 pandemic. Nat. Microbiol. 2020 doi: 10.1038/s41564-020-0771-4. - DOI - PubMed

MeSH terms

LinkOut - more resources