

Color of Pan Trap Influences Sampling of Bees in Livestock Pasture Ecosystem
- PMID: 34069447
- PMCID: PMC8159075
- DOI: 10.3390/biology10050445
Color of Pan Trap Influences Sampling of Bees in Livestock Pasture Ecosystem
Abstract
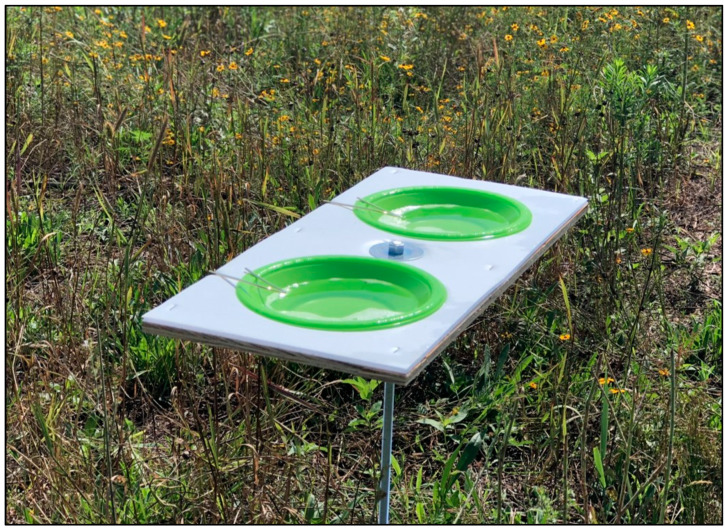
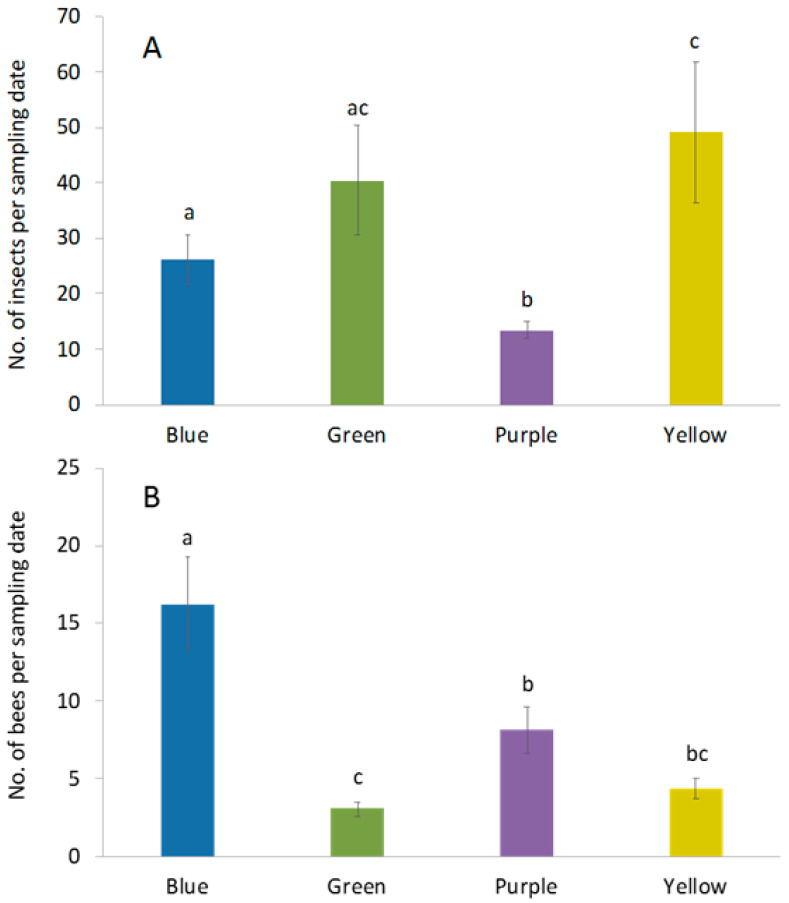
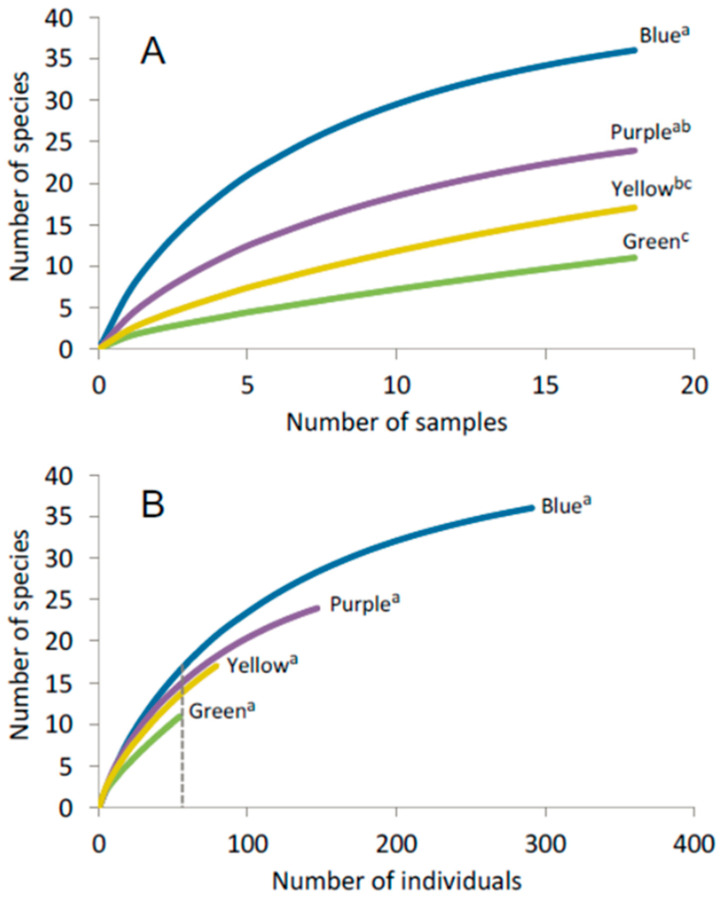
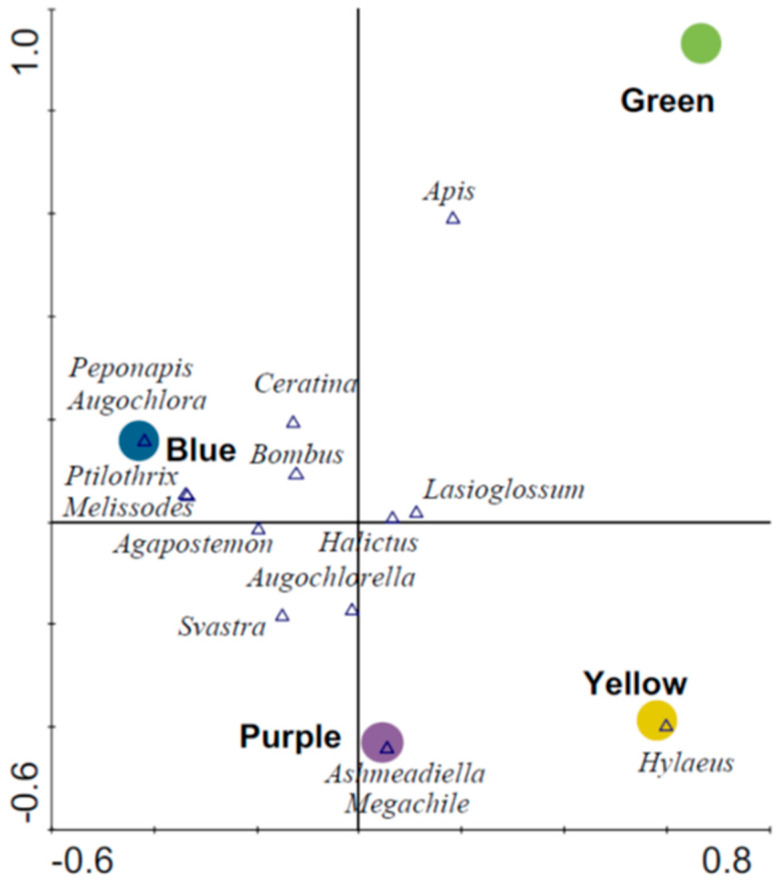
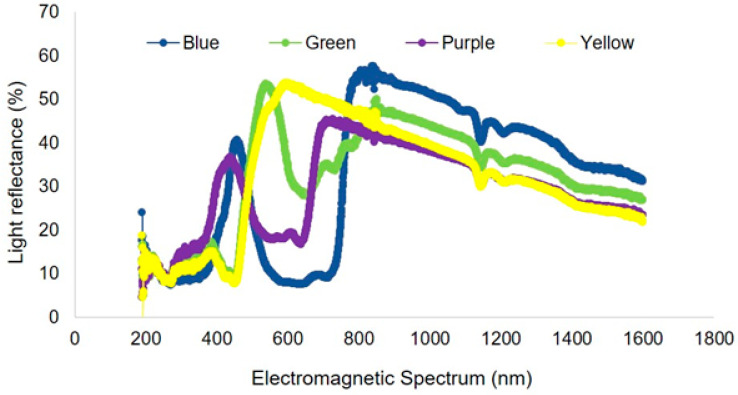
The decline in insect pollinators has increased the importance of accurately monitoring pollinator diversity and abundance over time. Sampling techniques include the use of passive insect traps such as pan traps, yet there is still discussion over their utility and effectiveness in different ecosystems. The objective was to examine four different colors of pan traps (blue, green, yellow, and purple) for their utility in sampling bees in native forages rotationally grazed by sheep and to compare the relative abundance, richness, similarity, and community assemblage patterns among the four trap colors. Most bees were from the Halictidae family (89%). The most abundant species were Lasioglossum imitatum (42.2%), Augochlorella aurata (8.3%), L. subviridatum (6.8), Agapostemon texanus (6.4), and L. birkmani (4.1%). Blue color traps exhibited the highest rates of bee capture and species accumulation. Purple and yellow colored traps were moderately effective in capturing bees, while the green color pan traps were least effective. Similarly, observed and extrapolated species richness was highest in blue trap, followed by purple, yellow, and green. Notably, the blue trap captured the highest number of unique species, followed by purple, yellow and green traps. Considering the total number of insects collected (including bees and other insects), yellow and green traps captured a significantly higher number of insects than other colored traps. The light reflectance from blue, purple, green and yellow pan traps had peaks at ~450, 400, 550, and 600 nm, respectively. Since different insects respond to different light intensities, wavelengths, and reflectivity, these results could be used to guide future trapping protocols targeting certain insect groups in livestock pasture and similar ecosystems.
Keywords: bee vision; bees; pan traps; pasture ecosystem; pollinators; sampling method.
Conflict of interest statement
The authors declare no conflict of interest. The funders had no role in the design of the study; in the collection, analyses, or interpretation of data; in the writing of the manuscript; or in the decision to publish the results.
Figures
References
-
- Vanbergen A.J., Initiative t.I.P. Threats to an ecosystem service: Pressures on pollinators. Front. Ecol. Environ. 2013;11:251–259. doi: 10.1890/120126. - DOI
-
- Le Féon V., Schermann-Legionnet A., Delettre Y., Aviron S., Billeter R., Bugter R., Hendrickx F., Burel F. Intensification of agriculture, landscape composition and wild bee communities: A large scale study in four European countries. Agric. Ecosyst. Environ. 2010;137:143–150. doi: 10.1016/j.agee.2010.01.015. - DOI
-
- Kells A.R., Holland J.M., Goulson D. The value of uncropped field margins for foraging bumblebees. J. Insect Conserv. 2001;5:283–291. doi: 10.1023/A:1013307822575. - DOI
-
- Wilson J.S., Griswold T., Messinger O.J. Sampling bee communities (Hymenoptera: Apiformes) in a desert landscape: Are pan traps sufficient? J. Kans. Entomol. Soc. 2008;81:288–300. doi: 10.2317/JKES-802.06.1. - DOI
LinkOut - more resources
Full Text Sources
