

Effects of PM2.5 on People's Emotion: A Case Study of Weibo (Chinese Twitter) in Beijing
- PMID: 34069467
- PMCID: PMC8159131
- DOI: 10.3390/ijerph18105422
Effects of PM2.5 on People's Emotion: A Case Study of Weibo (Chinese Twitter) in Beijing
Abstract
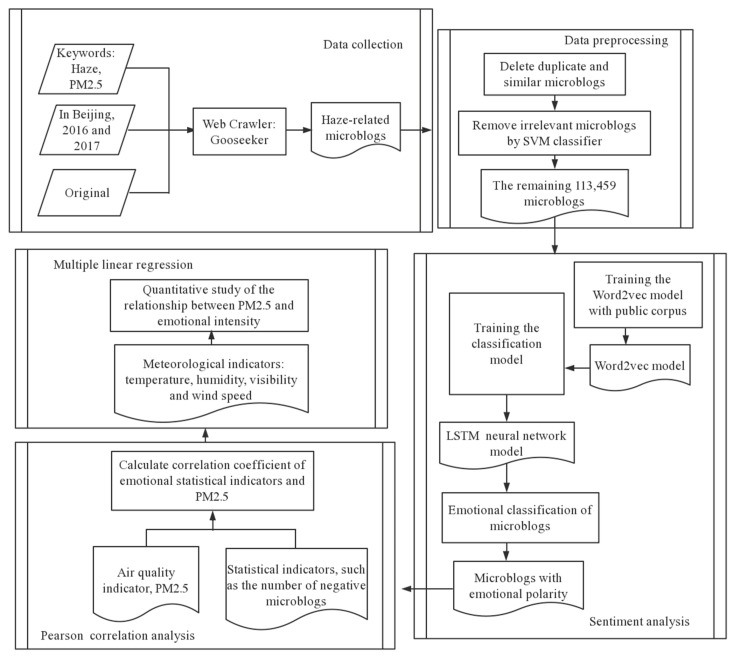
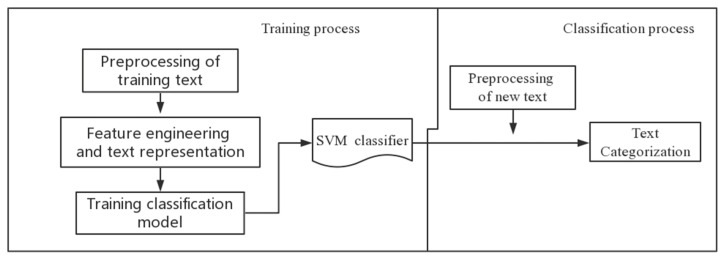
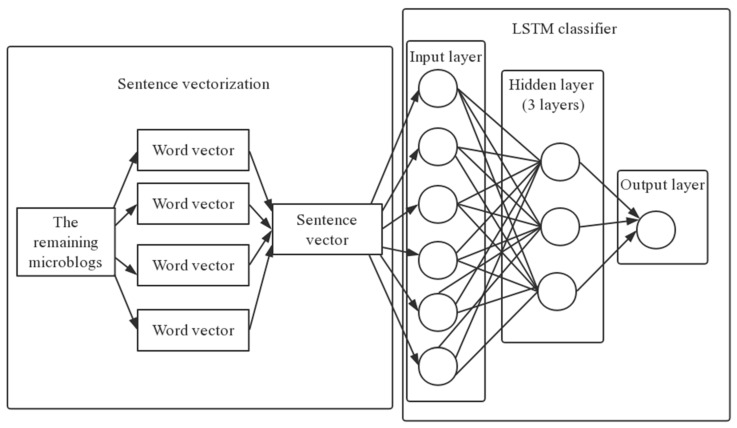
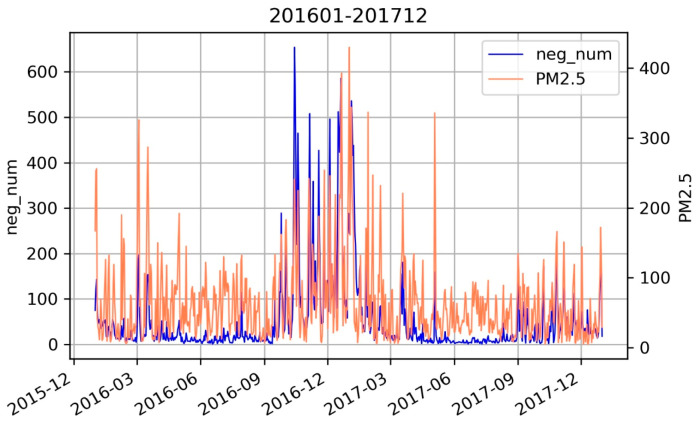
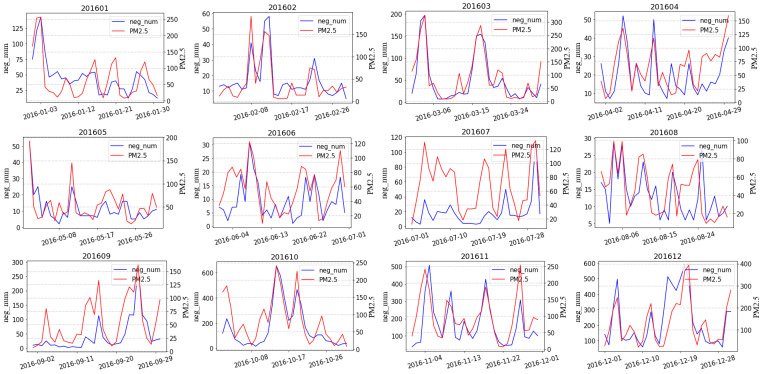
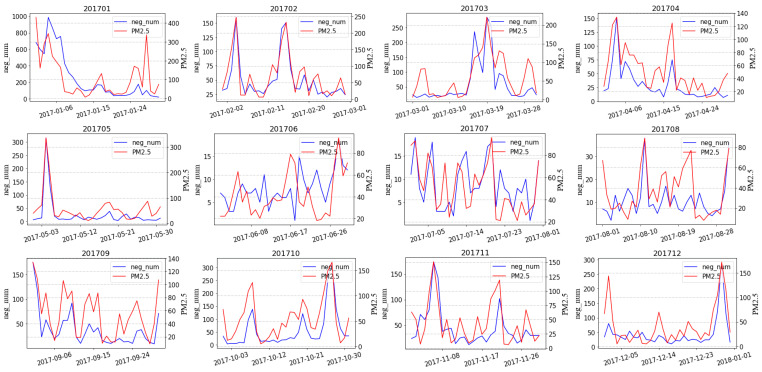
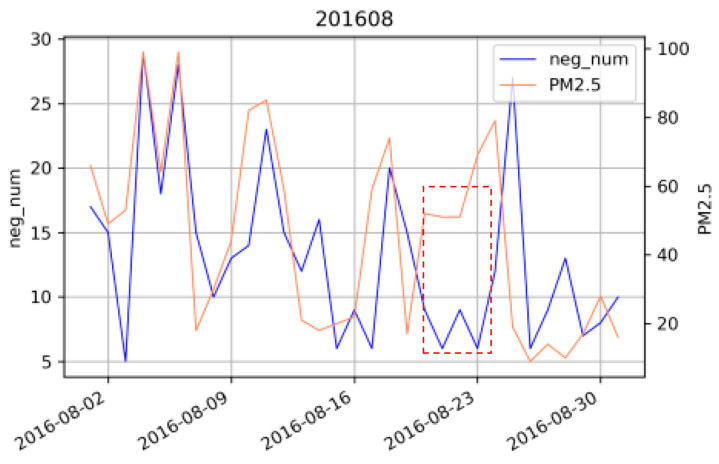
PM2.5 not only harms physical health but also has negative impacts on the public's wellbeing and cognitive and behavioral patterns. However, traditional air quality assessments may fail to provide comprehensive, real-time monitoring of air quality because of the sparse distribution of air quality monitoring stations. Overcoming some key limitations of traditional surface monitoring data, Web-based social media platforms, such as Twitter, Weibo, and Facebook, provide a promising tool and novel perspective for environmental monitoring, prediction, and evaluation. This study aims to investigate the relationship between PM2.5 levels and people's emotional intensity by observing social media postings. This study defines the "emotional intensity" indicator, which is measured by the number of negative posts on Weibo, based on Weibo data related to haze from 2016 and 2017. This study estimates sentiment polarity using a recurrent neural networks model based on LSTM (Long Short-Term Memory) and verifies the correlation between high PM2.5 levels and negative posts on Weibo using a Pearson correlation coefficient and multiple linear regression model. This study makes the following observations: (1) Taking the two-year data as an example, this study recorded the significant influence of PM2.5 levels on netizens' posting behavior. (2) Air quality, meteorological factors, the seasons, and other factors have a strong influence on netizens' emotional intensity. (3) From a quantitative viewpoint, the level of PM2.5 varies by 1 unit, and the number of negative Weibo posts fluctuates by 1.0168 units. Thus, it can be concluded that netizens' emotional intensity is significantly positively affected by levels of PM2.5. The high correlation between PM2.5 levels and emotional intensity and the sensitivity of social media data shows that social media data can be used to provide a new perspective on the assessment of air quality.
Keywords: PM2.5; machine learning; sentiment analysis; social media data.
Conflict of interest statement
The authors declare no conflict of interest. The funders had no role in the design of the study; in the collection, analyses, or interpretation of data; in the writing of the manuscript, or in the decision to publish the results.
Figures
Similar articles
-
Temporal Dynamics of Public Emotions During the COVID-19 Pandemic at the Epicenter of the Outbreak: Sentiment Analysis of Weibo Posts From Wuhan.J Med Internet Res. 2021 Mar 18;23(3):e27078. doi: 10.2196/27078. J Med Internet Res. 2021. PMID: 33661755 Free PMC article.
-
The impact factors of social media users' forwarding behavior of COVID-19 vaccine topic: Based on empirical analysis of Chinese Weibo users.Front Public Health. 2022 Sep 14;10:871722. doi: 10.3389/fpubh.2022.871722. eCollection 2022. Front Public Health. 2022. PMID: 36187642 Free PMC article.
-
Temporal and Emotional Variations in People's Perceptions of Mass Epidemic Infectious Disease After the COVID-19 Pandemic Using Influenza A as an Example: Topic Modeling and Sentiment Analysis Based on Weibo Data.J Med Internet Res. 2023 Nov 2;25:e49300. doi: 10.2196/49300. J Med Internet Res. 2023. PMID: 37917144 Free PMC article.
-
Sentiment Analysis of Texts on Public Health Emergencies Based on Social Media Data Mining.Comput Math Methods Med. 2022 Aug 9;2022:3964473. doi: 10.1155/2022/3964473. eCollection 2022. Comput Math Methods Med. 2022. PMID: 35983529 Free PMC article.
-
#WuhanDiary and #WuhanLockdown: gendered posting patterns and behaviours on Weibo during the COVID-19 pandemic.BMJ Glob Health. 2022 Apr;7(4):e008149. doi: 10.1136/bmjgh-2021-008149. BMJ Glob Health. 2022. PMID: 35414567 Free PMC article. Review.
Cited by
-
Outdoor Artificial Light at Night and Insomnia-Related Social Media Posts.JAMA Netw Open. 2024 Nov 4;7(11):e2446156. doi: 10.1001/jamanetworkopen.2024.46156. JAMA Netw Open. 2024. PMID: 39565624 Free PMC article.
-
How weather impacts expressed sentiment in Russia: evidence from Odnoklassniki.PeerJ Comput Sci. 2022 Nov 18;8:e1164. doi: 10.7717/peerj-cs.1164. eCollection 2022. PeerJ Comput Sci. 2022. PMID: 36426259 Free PMC article.
-
The Impact of Air Pollution on Residents' Happiness: A Study on the Moderating Effect Based on Pollution Sensitivity.Int J Environ Res Public Health. 2022 Jun 20;19(12):7536. doi: 10.3390/ijerph19127536. Int J Environ Res Public Health. 2022. PMID: 35742783 Free PMC article.
-
Inconsistent Association between Perceived Air Quality and Self-Reported Respiratory Symptoms: A Pilot Study and Implications for Environmental Health Studies.Int J Environ Res Public Health. 2023 Jan 13;20(2):1491. doi: 10.3390/ijerph20021491. Int J Environ Res Public Health. 2023. PMID: 36674246 Free PMC article.
-
Concerned or Apathetic? Using Social Media Platform (Twitter) to Gauge the Public Awareness about Wildlife Conservation: A Case Study of the Illegal Rhino Trade.Int J Environ Res Public Health. 2022 Jun 3;19(11):6869. doi: 10.3390/ijerph19116869. Int J Environ Res Public Health. 2022. PMID: 35682453 Free PMC article.
References
-
- Tan C.H., Zhao T.L., Cui C.G., Luo B.L., Zhang L., Bai Y.Q. Characterization of haze pollution over Central China during the past 50 years. China Environ. Sci. 2015;35:2272–2280.
-
- Guan D., Su X., Zhang Q., Peters G.P., Liu Z., Lei Y., He K. The socioeconomic drivers of China’s primary PM2.5 emissions. Environ. Res. Lett. 2014;9:024010. doi: 10.1088/1748-9326/9/2/024010. - DOI
-
- Levinson A. Valuing public goods using happiness data: The case of air quality. J. Public Econ. 2012;96:869–880. doi: 10.1016/j.jpubeco.2012.06.007. - DOI
Publication types
MeSH terms
Substances
LinkOut - more resources
Full Text Sources
Medical
